This chapter surveys some of the main stages in the life cycle of an Xcode project, from inception to submission at the App Store. This survey will provide an opportunity to discuss some additional features of the Xcode development environment. You already know how to create a project, define a class, and link to a framework (Chapter 6), as well as how to create and edit a nib (Chapter 7) and how to use the documentation (Chapter 8).
As you create a project (File → New → Project), after you pick a project template, in the screen where you name your project, the Devices pop-up menu offers a choice of iPad, iPhone, or Universal (meaning an app that runs on both iPhone and iPad natively, typically with a different interface on each type of device).
You are not tied forever to your initial decision, but your life will be simpler if you decide correctly from the outset. The iPhone and iPad differ in their physical characteristics as well as their programming interfaces. The iPad has a larger screen size, along with some built-in interface features that don’t exist on the iPhone, such as split views and popovers (Chapter 22); thus an iPad project’s nib files and some other resources will typically differ from those of an iPhone project.
Your choice in the Devices pop-up menu affects the details of the template on which your new project will be based. It also affects your project’s Targeted Device Family build setting:
- iPad
- The app will run only on an iPad.
- iPhone
- The app will run on an iPhone or iPod touch; it can also run on an iPad, but not as a native iPad app (it runs in a reduced enlargeable window, which I call the iPhone Emulator; Apple sometimes refers to this as “compatibility mode”).
- iPhone/iPad
- The app will run natively on both kinds of device, and should be structured as a universal app.
Two additional build settings determine what systems your device will run on:
- Base SDK
-
The latest system your app can run on. As of this writing, in Xcode 4.6, you have just two choices, iOS 6.1 and Latest iOS — but Latest iOS means iOS 6.1, so what’s the difference? It’s that, if you update Xcode to develop for a subsequent system, any existing projects that are already set to Latest iOS will use that newer system’s SDK as their Base SDK automatically, without your also having to update their Base SDK setting. Latest iOS is the default when you create a new project.
For example, while I was writing this book, iOS 6.1 was released, so the current iOS version changed from iOS 6.0 to iOS 6.1. All my existing projects automatically started using the iOS 6.1 SDK as their Base SDK, because Latest iOS, which had been interpreted previously as meaning iOS 6.0, was now interpreted as meaning iOS 6.1.
- iOS Deployment Target
- The earliest system your app can run on: in Xcode 4.5 and later, this can be any major iOS system number from the current system all the way back to 4.3. You can change the iOS Deployment Target setting easily by editing your project or your target: the project’s Info tab has an iOS Deployment Target pop-up menu, and the target’s Summary tab has a Deployment Target pop-up menu. These both represent the iOS Deployment Target build setting; you will probably want to edit the target, because if you edit the project only, the target setting will override it.
Writing an app whose Deployment Target differs from its Base SDK is something of a challenge. There are two chief problems:
- Unsupported features
-
With each new system, Apple adds new features. Xcode will happily allow you to compile using any features of the Base SDK, even if they don’t exist on the Deployment Target system; but your app will crash if execution encounters features not supported by the system (device or Simulator) on which it is actually running. Thus, if you were to set the target’s Deployment Target to iOS 5, it would be able to compile and run on an iOS 5 device even if it contained iOS 6–only features, but it would crash on the iOS 5 device if any of those features were actually encountered.
Our Empty Window project is a case in point. Install the iOS 5.1 Simulator SDK, change the Empty Window target’s Deployment Target to 5.1, set the destination in the Scheme pop-up menu to iPhone 5.1 Simulator, and run the project. Crash! Why? Because, by default, a new project’s nibs use autolayout, and any interface widgets they contain — such as the button in our ViewController.xib — use autolayout constraints, which are instances of NSLayoutConstraint. But there is no NSLayoutConstraint class in iOS 5.1 or before.
- Changed behavior
-
With each new system, Apple permits itself to change the way some features work. The result is that such features work differently on different systems, and will thus require two different sets of code. Sometimes these two sets of code can live side by side; sometimes you will have to write conditional code, so that one set of code executes when running on one system, another when running on another.
Interface rotation is an obvious case in point; this UIViewController feature (Chapter 19) was completely revised between iOS 5 and iOS 6. If your app launches into portrait orientation, the UIViewController methods called are totally different on the two different systems; code that launches your app correctly and successfully on iOS 5 might end up displaying a blank screen on iOS 6 (guess how I know that?). More insidiously, text is drawn differently on iOS 6 from how it was drawn on iOS 5; the very same code might thus display text in a certain position on iOS 5, but in a different position on iOS 6 (guess how I know that?).
How can you guard against such problems? Backwards compatibility isn’t easy, and it gets harder the further backwards you want to be compatible. Xcode 4.5 and later doesn’t support a Deployment Target earlier than 4.3; to compile for an earlier system, you’ll need an earlier version of Xcode. Xcode 4.5 and later doesn’t support a Simulator SDK earlier than 5.0; to test on an earlier version of the Simulator, you’ll need an earlier version of Xcode. But writing code compatible with an earlier version of Xcode is itself not easy; many of the modern Objective-C features used in this book won’t work in Xcode 4.2 or earlier. Moreover, testing in the Simulator is not enough; a physical device is essential for testing, implying that you need to maintain an arsenal of old iOS devices, in order to discover compatibility issues before your app is let loose upon a world of users. Personally, I adopt wherever possible the Dr. Kronkheit Defense (look it up on Wikipedia): Don’t do that. Once I’ve rewritten one of my apps for iOS 6, it usually runs only on iOS 6 or later.
Even if you can afford the luxury of not attempting backwards compatibility, however, you still might need to grapple with the problem of conditional code — if you want to write a universal app. Although you’ll probably want to reduce duplication by sharing some code between the iPhone and the iPad version of the app, nevertheless some code will likely have to be kept separate, because your app will need to behave differently on the different types of device. As I already mentioned, you can’t summon a popover on an iPhone; and the complexities can run considerably deeper, because the overall interfaces might be quite different, and might behave very differently — tapping a table cell on the iPhone might summon an entire new screenful of stuff, whereas on the larger iPad, it might only alter what appears in one region of the screen.
Various programming devices help govern dynamically what code is encountered, based on what system or device type the app is running on; thus you can steer your code away from a crash or from undesirable behavior based on the runtime environment (see also Example 29.1):
-
The UIDevice class lets you query the current device to learn its system version (
systemVersion) and type (userInterfaceIdiom, eitherUIUserInterfaceIdiomPhoneorUIUserInterfaceIdiomPad):if ([UIDevice currentDevice].userInterfaceIdiom == UIUserInterfaceIdiomPhone) { // do things appropriate to iPhone } else { // do things appropriate to iPad }For an actual example, make a Universal project from the Master–Detail Application template and look in AppDelegate.m. You’ll see code that configures the initial interface differently depending on the device type we’re running on.
-
Certain Info.plist settings apply only to one device type or the other. Again, a Universal project based on the Master–Detail Application template is a case in point. You’ll see that the Info.plist contains two sets of “Supported interface orientations” settings, a general set and an iPad-only set that overrides the general case when the app launches on an iPad.
Similarly, if you create your Master-Detail Application Universal project with Use Storyboards checked, the project contains two storyboards, one containing the interface for running on an iPhone, the other for an iPad. The choice between them is made through the Info.plist setting “Main storyboard file base name”, which appears twice, once for the general case and once for iPad only, the latter overriding the former when the app launches on an iPad. (If you create your Master-Detail Application Universal project without Use Storyboards checked, the project contains two pairs of nibs, and the choice of which ones to load as the app launches is made in code, in App Delegate’s
application:didFinishLaunchingWithOptions:, using theuserInterfaceIdiomtechnique from the previous paragraph.) -
Many calls that load resources by name from your app’s bundle will automatically select an alternative resource whose name (before the extension) ends with
~iphoneor~ipadas appropriate to the device type — if there is such an alternative resource. This relieves your code from using conditionals. For example, UIImage’simageNamed:method, if you specify the image name as@"linen.png", will load an image called linen~ipad.png if it finds one and if we’re running on an iPad. We’ll see in Chapter 15 that the same sort of naming convention will also help you automatically load a double-resolution image on a device with a double-resolution screen. - If your app is linked to a framework and tries to run on a system that lacks that framework, it will crash at launch time. The solution is to link to that framework optionally, by changing the Required pop-up menu item in its listing in the target’s Linked Frameworks and Libraries to Optional; this is technically referred to as weak-linking the framework.
-
You can test for the existence of a method using
respondsToSelector:and related NSObject calls:if ([UIButton respondsToSelector: @selector(appearance)]) { // ok to call appearance class method } else { // don't call appearance class method } -
You can test for the existence of a class using the
NSClassFromStringfunction, which yields nil if the class doesn’t exist. Also, if the Base SDK is 5.0 or later, and if the class’s framework is present or weak-linked, you can send the class any message (such as[CIFilter class]) and test the result for nil; this works because classes are themselves weak-linked starting in iOS 5:// assume Core Image framework is weak-linked if ([CIFilter class]) { // ok to do things with CIFilter -
You can test for the existence of a constant name, including the name of a C function, by taking the name’s address and testing against zero. For example:
if (&UIApplicationWillEnterForegroundNotification) {
    // OK to refer to UIApplicationWillEnterForegroundNotification
A device can be set by the user to prefer a certain language as its primary language. You might like the text in your app’s interface to respond to this situation by appearing in that language. This is achieved by localizing the app for that language.
Localization operates through localization folders in your project and in the built app bundle. Let’s say that a resource in one of these localization folders has a counterpart in the other localization folders. Then, when your app goes to load such a resource, it automatically loads the one appropriate to the user’s preferred language.
For example, if there’s a copy of InfoPlist.strings in the English localization folder and a copy of InfoPlist.strings in the French localization folder, the latter will be used when the app needs a copy of InfoPlist.strings on a device on which French is the preferred language. Not for nothing have I used InfoPlist.strings as my example. This is a file that’s present by default in your project — for example, it appears in our Empty Window example project — but its purpose wasn’t discussed in Chapter 6, so presumably you’ve been on tenterhooks since then, wondering what it was for. Well, it’s a .strings file; the purpose of a .strings file is to be localized.
The purpose of this particular .strings file, InfoPlist.strings, is to store localized versions of Info.plist key values. So, for example, the value of the CFBundleDisplayName key, as set in your project’s Info.plist file, appears under your app’s icon on the user’s device. We might want to change this name depending the user’s primary language setting. For example, on a French language device, we might like our Empty Window app to be called Fenêtre Vide.
As an example of localization, let’s arrange for that very thing to happen. First we must set up our app for localization to French; then we must localize InfoPlist.strings.
- Edit the project. Under Info, the Localizations table lists our app’s localizations.
- Click the Plus button under the Localizations table. From the pop-up menu that appears, choose French.
- A dialog appears, listing files that are currently localized for English (because they came that way as part of the app template). We’re dealing here with just InfoPlist.strings, so leave it checked but uncheck any other files that appear here. Click Finish.
We have now set up InfoPlist.strings to be localized for both English and French. This fact is reflected in two ways:
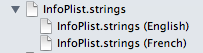
- In the Project navigator, the listing for InfoPlist.strings has acquired a flippy triangle. Open the triangle to reveal that our project now contains two copies of InfoPlist.strings, one for English and one for French (Figure 9.1). Thus we can now edit either one individually.
- In the Empty Window project folder on disk, there is now both an en.lproj folder and a fr.lproj folder. The former contains the copy of InfoPlist.strings destined for English language users; the latter contains the copy of InfoPlist.strings destined for French language users. Moreover, when we build, this folder structure is copied into the built app.
Now let’s edit our InfoPlist.strings files. A .strings file is simply a collection of key–value pairs in the following format:
/* Optional comments are C-style comments */
"key" = "value";
In the case of InfoPlist.strings, the key is simply the key name from Info.plist — the raw key name, not the English-like name. So the English InfoPlist.strings should look like this:
"CFBundleDisplayName" = "Empty Window";
The French InfoPlist.strings should look like this:
"CFBundleDisplayName" = "Fenêtre Vide";
Now let’s try it!
- Build and run Empty Window on the iPhone Simulator.
- In Xcode, stop the running project. In the Simulator, the home screen is revealed.
- Examine the name of our app, as displayed in the Simulator home screen. It is Empty Window (truncated to “Empty…ndow”).
- In the Simulator, launch the Settings app and change the language to French (General → International → Language → Français). Our app’s name is now displayed as Fenêtre Vide.
Is this fun or what? When you’re done marveling at your own cosmopolitanism, change the Simulator’s language back to English.
Now let’s talk about nib files (and storyboard files). Before Xcode 4.5 and iOS 6, the case of a nib file (or storyboard file) was similar to what we just did with InfoPlist.strings: it was necessary to localize the entire nib (or storyboard). So, for example, you would have selected ViewController.xib in the Project navigator, switched to the File inspector, and checked French in the Localization table. This would cause you to end up with two copies of ViewController.xib, and you would edit each one so that any text displayed in the interface, such as button titles, appeared in the appropriate language.
Starting in Xcode 4.5 and iOS 6, however, there’s a better way:
- Edit the project again, and below the Localization table, check Use Base Internationalization.
- A dialog appears, listing nib and storyboard files that are currently localized only for English. At present, it lists just ViewController.xib, and it is checked. That’s good! Click Finish.
- Back in the Project navigator, select ViewController.xib. Look in the File inspector. The Localization table now contains three entries: Base, English, and French. Base is already checked. Check French.
- Clean the build folder (hold Option and choose Product → Clean Build Folder)! Omitting this step will probably cause your app to misbehave in future.
In the Project navigator, the result is that ViewController.xib has a flippy triangle. Open it to reveal that ViewController.xib is now split into two different types of file:
- If the user’s device is not localized for French, the Base file will be used. That’s the nib file itself, which has been moved on disk into a new Base.lproj folder. Thus we can continue to edit the nib file, ViewController.xib, using English as the default language.
- If the user’s device is localized for French, a .strings file will be used — ViewController.strings, located on disk inside the fr.lproj folder. This file, including the keys and initial values, has been generated for us automatically based on the content of ViewController.xib.
So, at the moment the French ViewController.strings file contains this line:
"38.normalTitle" = "Button";
Let’s change that to French. Don’t change the key! It’s meaningless to you and out of your control (though if you’re really determined you can pretty easily work out how it is derived), and you don’t want to break the connection between this string and the button to which it applies. Change only the value:
"38.normalTitle" = "Bouton";
Build and run the app in the Simulator and switch languages as before to see the effects of your work.
Finally, what about strings that appear in your app’s interface but whose value is generated in code? (In the Empty Window app as we’ve developed it so far, examples include the modified text of the UILabel, or the content of the alert summoned by tapping the button.) The approach is the same — a .strings file — but your code must be modified to use it explicitly. There are various ways to do this, but the simplest is to use the NSLocalizedString macro (which calls an NSBundle instance method, localizedStringForKey:table:). So, for example, we might modify our buttonPressed: method to look like this:
UIAlertView* av = [[UIAlertView alloc]
                   initWithTitle:NSLocalizedString(@"AlertGreeting", nil)
                   message:NSLocalizedString(@"YouTappedMe", nil)
                   delegate:nil
                   cancelButtonTitle:NSLocalizedString(@"Cool", nil)
                   otherButtonTitles:nil];
The string provided as the first argument to NSLocalizedString is the key in a .strings file. Our code is now broken, however, as there is no corresponding .strings file. By default, the .strings file expected here is called Localizable.strings. But no such file exists. There’s no error, but these keys have no value either — so the key itself is used when the alert appears, which is not what we want. You’ll need to create the required .strings file:
- Choose File → New → File.
- The "choose a template" dialog appears. On the left, under iOS, select Resource. On the right, select Strings File. Click Next.
- Name the file Localizable.strings. Pick an appropriate Group, and make sure this file is part of our Empty Window target. Click Create.
- Now we must localize the new file. In the Project navigator, select Localizable.strings. In the File inspector, under Localization, click the “Make localized” button. A dialog offers to move the existing file into the English localization, which is exactly what you want.
- In the File inspector, you can now add localizations as desired. For example, you could check French.
You must now also provide our Localizable.strings files with content, in accordance with the localizable string keys specified in your code. What? We have to comb through our code, looking for calls to NSLocalizedString, and copying out the keys into our .strings files? This sounds like a royal pain, not to mention being an invitation to make some careless mistake. Fortunately, the genstrings command-line tool will do the work for you, seeking out the NSLocalizedString calls and generating the initial contents of a .strings file (using the keys as default values). So, for example, on my machine I would now say, in the Terminal:
$ genstrings /Users/matt/Desktop/Empty\ Window/Empty\ Window/ViewController.m
The result is a file Localizable.strings in the current directory, reading as follows:
/* No comment provided by engineer. */
"AlertGreeting" = "AlertGreeting";

/* No comment provided by engineer. */
"Cool" = "Cool";

/* No comment provided by engineer. */
"YouTappedMe" = "YouTappedMe";
We are now waving our hands; completing the localization of our Empty Window project is left as an exercise for the reader. For a full if somewhat outdated discussion of localization, see Apple’s Internationalization Programming Topics.
Many aspects of Xcode’s editing environment can be modified to suit your tastes. Your first step should be to pick a font face and size you like in the Fonts & Colors preference pane. Nothing is so important as being able to read and write code comfortably! I like a largish size (13, 14 or even 16) and a pleasant monospaced font such as Monaco, Menlo, or Consolas (or the freeware Inconsolata).
Xcode has some formatting, autotyping, and text selection features adapted for Objective-C. Exactly how these behave depends upon your settings in the Editing and Indentation tabs of Xcode’s Text Editing preference pane. I’m not going to describe these settings in detail, but I urge you to take advantage of them. Under Editing, I like to check just about everything, including Line Numbers; visible line numbers are useful when debugging. Under Indentation, I like to have just about everything checked too; I find the way Xcode lays out Objective-C code to be excellent with these settings. A sound approach might be to check everything initially and then, when you’ve some experience editing with Xcode, switch off features you don’t prefer.
If you like Xcode’s smart syntax-aware indenting, but you find that once in a while a line of code isn’t indenting itself correctly, try choosing Editor → Structure → Re-Indent (Control-I), which autoindents the current line. (Autoindent problems can also be caused by incorrect syntax earlier in the file, so hunt for that too.)
Under Editing, notice “Automatically balance brackets in Objective-C method calls.” If this option is checked, then when you type a closing square bracket after some text, Xcode intelligently inserts the opening square bracket before the text. I like this feature, as it allows me to type nested square brackets without planning ahead. For example, I type this:
UIAlertView* av = [UIAlertView alloc
I now type the right square bracket twice. The first right square bracket closes the open left square bracket (which highlights to indicate this). The second right square bracket also inserts a space before itself, plus the missing left square bracket:
UIAlertView* av = [[UIAlertView alloc] ]
//           insertion point is here: ^
The insertion point is positioned before the second right square bracket, ready for me to type init.
With “Enable type-over completions” checked, Xcode goes even further. As I start to type that same line of code:
UIAlertView* av = [U
Xcode automatically appends the closing right square bracket, with the insertion point still positioned before it:
UIAlertView* av = [U]
That closing right square bracket, however, is tentative; it’s in gray. When I finish typing the first nested method call:
UIAlertView* av = [UIAlertView alloc]
I can now confirm the closing right square bracket in any of several ways. I can actually type a right square bracket; or I can type Tab or Right arrow. The tentative right square bracket is replaced by a real right square bracket, and the insertion point is now positioned after it, ready for me to continue typing. With practice, you’ll quickly get used to this feature, which has greatly increased my own fluidity in typing code.
As you write code, you’ll take advantage of Xcode’s autocompletion feature. Objective-C is a verbose language, and whatever reduces your time and effort typing will be a relief. However, I personally do not check “Suggest completions while typing” under Editing; instead, I check “Use Escape key to show completion suggestions”, and when I want autocompletion to happen, I ask for it manually, by pressing Esc.
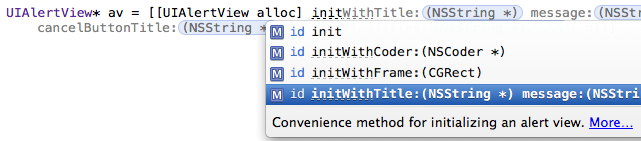
For example, suppose my code is as displayed in the previous example, with the insertion point before the second right square bracket. I now type init and then press Esc, and a little menu pops up, listing the four init methods appropriate to a UIAlertView (Figure 9.2). You can navigate this menu, dismiss it, or accept the selection, using only the keyboard. So, if it were not already selected by default, I would navigate to initWithTitle:... and press Return to accept the selected choice.
Alternatively, I might press Control-Period instead of Esc. Pressing Control-Period repeatedly cycles through the alternatives. Again, press Return to accept the selected choice. Another possibility is to press Tab, which performs a partial completion without dismissing the autocompletion menu; in Figure 9.2, if I were to press Tab at this moment, initWith would be completed in my code — that’s what the dashed underlines are telling me — and bare init, no longer an eligible completion, would be eliminated from the menu.
Observe also that there is a reduced form of Quick Help at the bottom of the autocompletion menu; click the More link to view (in the documentation window) the full documentation for the currently selected method (Chapter 8).
When I choose an alternative from the autocompletion menu, the template for the correct method call is entered in my code (I’ve broken it manually into multiple lines to show it here):
[[UIAlertView alloc] initWithTitle:<#(NSString *)#>
                           message:<#(NSString *)#>
                          delegate:<#(id)#>
                 cancelButtonTitle:<#(NSString *)#>
                 otherButtonTitles:<#(NSString *), ...#>, nil]
The expressions in <#...#> are placeholders, showing the type of each parameter; you can select the next placeholder with Tab (if the insertion point precedes a placeholder) or by choosing Navigate → Jump to Next Placeholder (Control-Slash). Thus I can select a placeholder and type in its place the actual argument I wish to pass, select the next placeholder and type that argument, and so forth.
Note
Placeholders are delimited by <#...#> behind the scenes,
but they appear in Xcode as “text tokens” to prevent them from being edited accidentally.
To convert a placeholder to a normal string without the delimiters, select it and press Return, or double-click it.
Autocompletion also works for method declarations. You don’t have to know or enter a method’s return type beforehand. Just type the initial - or + (to indicate an instance method or a class method) followed by the first few letters of the method’s name. For example, in my app delegate I might type:
- appli
If I then press Esc, I see a list of methods such as application:didChangeStatusBarFrame:; these are methods that might be sent to my app delegate (by virtue of its being the app delegate, as discussed in Chapter 11). When I choose one, the declaration is filled in for me, including the return type and the parameter names:
- (void)application:(UIApplication *)application
    didChangeStatusBarFrame:(CGRect)oldStatusBarFrame
At this point I’m ready to type the left curly brace, followed by a Return character; this causes the matching right curly brace to appear, with the insertion point positioned between them, ready for me to start typing the body of this method.
Code autocompletion is supplemented by code snippets. A code snippet is a bit of text with an abbreviation. Code snippets are kept in the Code Snippet library (Control-Option-Command-2), but a code snippet’s abbreviation is globally available, so you can use it without showing the library. You type the abbreviation and the snippet’s name is included among the possible completions.
For example, to enter an if block, I would type if and press Esc, to get autocompletion, and select “If Statement”. When I press Return, the if block appears in my code, and the condition area (between the parentheses) and statements area (between the curly braces) are placeholders.
To learn a snippet’s abbreviation, you must open its editing window — double-click the snippet in the Code Snippet library — and click Edit. If learning a snippet’s abbreviation is too much trouble, simply drag it from the Code Snippet library into your text.
You can add your own snippets, which will be categorized as User snippets; the easiest way is to drag text into the Code Snippet library. Edit to suit your taste, providing a name, a description, and an abbreviation; use the <#...#> construct to form any desired placeholders.
Xcode’s extremely cool Fix-it feature can actually make and implement positive suggestions on how to avert a problem. To summon it, click on an issue badge in the gutter. Such an issue badge will appear after compilation if there’s a problem.
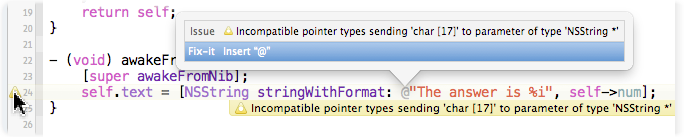
For instance, in Figure 9.3 I’ve accidentally omitted the @ before an Objective-C NSString literal, and the compiler is warning (because what I’ve typed is a C string literal, a very different thing). By clicking on the warning badge in the gutter, I’ve summoned a little dialog that not only describes the mistake but tells me how to fix it. Not only that: it has tentatively (in grey) implemented that solution; it has inserted the missing @ into my code. Not only that: if I press Return, or double-click the “Fix-it” button in the dialog, Xcode really inserts the missing @ into my code — and the warning vanishes, because the problem is solved. If I’m confident that Xcode will do the right thing, I can choose Editor → Fix All in Scope (Control-Option-Command-F), and Xcode will implement all nearby Fix-it suggestions without my even having to show the dialog.
Live syntax checking is like a form of constant compilation. Even if you don’t compile or even save, live syntax checking can detect the presence of a problem, and can suggest the solution with Fix-it. This feature can be toggled on or off using the “Show live issues” checkbox in the General preference pane. Personally, I keep it turned off, as I find it intrusive. My code is almost never valid while I’m typing, because the terms and parentheses are always half-finished; that’s what it means to be typing. For example, merely typing a left parenthesis will instantly cause the syntax checker to complain of a parse error (until I type the corresponding right parenthesis).
Developing an Xcode project involves editing code in many files at once. Xcode provides numerous ways to navigate your code. Many of these have been mentioned in previous chapters. Most navigation methods can be tweaked with the Option key to navigate in an assistant pane instead of the main editor, or with Shift-Option to bring up the navigation window.
- The Project navigator
-
If you know something about the name of a file, you can find it quickly in the Project navigator (Command-1) by typing into the search field in the filter bar at the bottom of the navigator (Edit → Filter → Filter in Navigator, Command-Option-J). For example, type
xibto see just your nib files. Moreover, after using the filter bar, you can press Tab and then the Up or Down arrow key to navigate the Project navigator. Thus you can reach the desired file with the keyboard alone. - The Symbol navigator
- If you highlight the first two icons in the filter bar (the first two are dark, the third is light), the Symbol navigator lists your project’s classes and their methods. Now you can navigate to a desired method. As with the Project navigator, the filter bar’s search field can quickly get you where you want to go.
- The jump bar
-
Every path component of the jump bar is a menu:
- The bottom level
-
At the bottom level (farthest right) in the jump bar is a list of your file’s method and function declarations and definitions, in the order in which they appear (hold Command while choosing the menu to see them in alphabetical order); choose one to navigate to it. Start typing while the menu is open to filter what the menu displays.
You can add section titles to this bottom-level menu using the
#pragma markdirective. For example, try modifying ViewController.m in our Empty Window project:#pragma mark - View lifecycle - (void)viewDidLoad { [super viewDidLoad]; // Do any additional setup after loading the view... }The result is that the “viewDidLoad” item in the bottom-level menu falls within a “View lifecycle” section. (But only if a method definition precedes the
#pragmaline. I regard this limitation as a bug.)To make a section divider line in the menu, type a
#pragma markdirective whose value is a hyphen; in the preceding example, both a hyphen (to make a section divider line) and a title (to make a bold section title) are used. Similarly, comments outside of any method and starting withTODO:,FIXME:,???:, or!!!:will appear in the bottom-level menu. - Higher levels
- Higher-level path components are hierarchical menus; thus you can use any of them to work your way down the file hierarchy.
- History
- Each editor pane remembers the names of files you’ve edited in it. The Back and Forward triangles are both buttons and pop-up menus (or choose Navigate → Go Back and Navigate → Go Forward, Control-Command-Left and Control-Command-Right).
- Related items
- The leftmost button in the jump bar summons a hierarchical menu of files related to the current file, such as counterparts, superclasses, and included files. New in Xcode 4.5 and later, this list even includes methods that call or are called by the currently selected method.
- The Assistant pane
-
The Assistant lets you be in two places at once. Hold Option while navigating to open something in an Assistant pane instead of the primary editor pane.
The first path component in an Assistant pane’s jump bar sets its automatic relationship to the main pane (tracking). This is effectively the same hierarchical menu of related items I mentioned a moment ago, applied to the main pane. If the chosen relationship involves multiple files, triangle buttons appear at the right end of the jump bar, letting you navigate between them; or choose from the second path component’s pop-up menu (Control-5). For example, show AppDelegate.m in the main pane and switch the assistant pane’s related items pop-up menu to Includes; the triangle buttons at the right end of the jump bar then navigate between different files
#imported by AppDelegate.m.You can also be in two places at once by opening a tab or a separate window.
- Jump to definition
- Navigate → Jump to Definition (Control-Command-J) lets you jump to the declaration or definition of the symbol already selected in your code.
- Open quickly
- File → Open Quickly (Shift-Command-O) searches in a dialog for a symbol in your code and the Cocoa headers. You can type the symbol in the search field, or, if a symbol is selected when you summon the dialog, it will be entered in the search field for you. You can navigate the dialog entirely with the keyboard.
- Breakpoints
- The Breakpoint navigator lists all breakpoints in your code. Xcode lacks code bookmarks, but you can misuse a disabled breakpoint as a bookmark. Breakpoints are discussed later in this chapter.
- Finding
-
Finding is a form of navigation. Xcode has both a global find (Edit → Find → Find in Workspace, Shift-Command-F, which is the same as using the Search navigator) and an editor-level find (Edit → Find → Find, Command-F); don’t confuse them.
Find options are all-important. Both sorts of find have options that you can summon by clicking the magnifying glass. The global find options (Figure 6.3) allow you to specify the scope of a search (which files will be searched) in sophisticated ways: choose Custom in the “Find in” pop-up menu to create a scope. The global find search bar also pops down a menu automatically as you type if the find options aren’t showing, letting you switch among the most important options. You can also find using regular expressions. There’s a lot of power lurking here.
To replace text, click on the word Find at the left end of the search bar to summon the pop-up menu, and choose Replace. (It may be necessary to perform a global find first, before a global replace on the same search term will work.) You can replace all occurrences, or select particular find results in the Search navigator and replace only those (click Replace instead of Replace All). The Search navigator’s Preview button summons a dialog that shows you the effect of each possible replacement, and lets you check or uncheck particular replacements in advance of performing the replacement. For editor-level find, hold Option before clicking Replace All, to find-and-replace within only the current selection.
A sophisticated form of editor-level find is Editor → Edit All In Scope, which finds simultaneously all occurrences of the currently selected term (usually a variable name) within the current set of curly braces; you can use this to change a variable’s name throughout its scope, or just to survey how the name is used.
Debugging is the art of figuring out what’s wrong with the behavior of your app as it runs. I divide this art into two main techniques: caveman debugging and pausing your running app.
Caveman debugging consists of altering your code, usually temporarily, typically by adding code to dump informative messages into the console.
The standard command for sending a message to the console is NSLog. It’s a C function, and it takes an NSString which operates as a format string, followed by the format arguments.
A format string is a string (here, an NSString) containing symbols called format specifiers, for which values (the format arguments) will be substituted at runtime. All format specifiers begin with a percent sign (%), so the only way to enter a literal percent sign in a format string is as a double percent sign (%%). The character(s) following the percent sign specify the type of value that will be supplied at runtime. The most common format specifiers are %@ (an object reference), %i (an integer), %f (a float), and %p (a pointer, usually an object reference, shown as the address in memory pointed to, useful for making certain that two references refer to the same instance). For example:
NSLog(@"the window: %@", self.window);
In that example, self.window is the first (and only) format argument, so its value will be substituted for the first (and only) format specifier, %@, when the format string is printed in the console. Thus the console output looks something like this:
the window: <UIWindow: 0x6a08140; frame = (0 0; 320 480);
             layer = <UIWindowLayer: 0x6a08230>>
This nice display of information is due to UIWindow’s implementation of the description method: an object’s description method is called when that object is used with the %@ format specifier. For this reason, you will probably want to implement description in your own classes, so that you can investigate an instance with a simple NSLog call.
For the complete repertory of format specifiers available in a format string, read Apple’s document String Format Specifiers. The format specifiers are largely based on those of the C printf standard library function; see K&R B1.2, the sprintf man page, and the IEEE printf specification linked from the documentation.
Warning
If an object reference has been set to nil, NSLog will report it as (null). But if an object reference is uninitialized, an NSLog call referring to it will probably fail silently, or even crash the debugger.
This is very frustrating, especially since the fact that this object reference is uninitialized is probably just what you were trying to debug. Fortunately, if you use ARC (Chapter 12), an object reference is autoinitialized to nil if you don’t initialize it explicitly.
The main ways to go wrong with NSLog (or any format string) are to supply a different number of format arguments from the number of format specifiers in the string, or to supply an argument value different from the type declared by the corresponding format specifier. I often see beginners claim that logging shows a certain value to be nonsense, when in fact it is their NSLog call that is nonsense; for example, a format specifier was %i but the value of the corresponding argument was a float.
Fortunately, recent versions of the compiler will try to help you with warnings.
C structs are not objects, so to see a struct’s value with NSLog you must somehow deconstruct or translate the struct. Common Cocoa structs usually supply convenience functions for this purpose. For example:
NSLog(@"%@", NSStringFromCGRect(self.window.frame)); // {{0, 0}, {320, 480}}
Purists may scoff at caveman debugging, but I use it heavily: it’s easy, informative, and lightweight. And sometimes it’s the only way. Unlike the debugger, NSLog works with any build configuration (Debug or Release) and wherever your app runs (in the Simulator or on a device). It works when pausing is impossible (because of threading issues, for example). It even works on someone else’s device, such as a tester to whom you’ve distributed your app. It’s a little tricky for a tester to get a look at the console so as to be able to report back to you, but it can be done: the tester can connect the device to a computer and view its log in Xcode’s Organizer window or with Apple’s iPhone Configuration Utility; there’s also a free utility app called Console that displays the log right on the device.
Remember to remove or comment out NSLog calls before shipping your app, as you probably don’t want your finished app to dump lots of messages into the console. A useful trick (shamelessly stolen from Jens Alfke) is to call MyLog instead of NSLog, and define MyLog like this in your precompiled header (and when it’s time to stop logging, change the 0 to 1):
#define MyLog if(0); else NSLog
A useful fact when logging is that the variable name _cmd holds the selector for the current method.
Thus a single form of statement can signal where you are:
NSLog(@"Logging %@ in %@", NSStringFromSelector(_cmd), self);
(Similarly, in a C function, NSLog(@"%s", __FUNCTION__) logs the name of the function.)
Another sort of call with which you can pepper your code is asserts. Asserts are conditions that you claim (assert) are true at that moment — and you feel so strongly about this that you want your app to crash if you’re wrong. Asserts are a very good way to confirm that the situation matches your expectations, not just now as you write your code, but in the future as the app develops.
The simplest form of assert is the C function (actually it’s a macro) assert, to which you pass one argument, a condition — something that can be evaluated as false (0) or true (some other value). If it’s false, your app will crash when this line is encountered, along with a nice explanation in the log. For example, suppose we assert NO, which is false and will certainly cause a crash. Then when this line is encountered we crash with this log message:
Assertion failed: (NO),
function -[AppDelegate application:didFinishLaunchingWithOptions:],
file /Users/mattleopard/Desktop/testing/testing/AppDelegate.m, line 20.
That’s plenty for us to track down the assertion failure: we know the assertion condition, the method in which the assertion occurred, the file containing that method, and the line number.
For higher-level asserts, look at NSAssert (used in Objective-C methods) and NSCAssert (used in C functions). They allow you to form your own log message, which is to appear in the console in addition to the native assert logging; the log message can be a format string followed by values corresponding to the format specifiers, as with NSLog.
Some developers think that asserts should be allowed to remain in your code even when your app is finished. By default, however, higher-level asserts are disabled in a Release build, thanks to the Other C Flags build setting, which is set to -DNS_BLOCK_ASSERTIONS=1 in Apple’s project templates; the effect of this setting is to #define the preprocessor macro NS_BLOCK_ASSERTIONS, which in turn is the signal for asserts to be effectively neutered at precompile time. To keep asserts working in a Release build, clear that value from the Other C Flags build setting in your target.
When you’re building and running in Xcode, you can pause in the debugger and use Xcode’s debugging facilities. There isn’t a strong difference between running and debugging in Xcode; the main distinction is whether breakpoints are effective or ignored. The effectiveness of breakpoints can be toggled at two levels:
- Globally
- Breakpoints as a whole are either active or inactive. If breakpoints are inactive, we won’t pause at any breakpoints.
- Individually
- A given breakpoint is either enabled or disabled. Even if breakpoints are active, we won’t pause at this one if it is disabled. Disabling a breakpoint allows you to leave in place a breakpoint that you might need later without pausing at it every time it’s encountered.
A breakpoint, then, is ignored if it is disabled or if breakpoints as a whole are inactive.
The important thing, if you want to use the debugger, is that the app should be built with the Debug build configuration. The debugger is not very helpful against an app built with the Release build configuration, not least because compiler optimizations can destroy the correspondence between steps in the compiled code and lines in your code. Trying to debug a Release build is a common beginner error (though it’s less likely to occur accidentally in Xcode 4, in which by default a scheme’s Run action uses the Debug build configuration).
To create a breakpoint (Figure 9.4), select in the editor the line where you want to pause, and choose Product → Debug → Add Breakpoint at Current Line (Command-Backslash). This keyboard shortcut toggles between adding and removing a breakpoint for the current line. The breakpoint is symbolized by an arrow in the gutter. Alternatively, a simple click in the gutter adds a breakpoint; to remove a breakpoint gesturally, drag it out of the gutter.

To disable a breakpoint at the current line, click on the breakpoint in the gutter to toggle its enabled status. Alternatively, Control-click on the breakpoint and choose Disable Breakpoint in the contextual menu. A dark breakpoint is enabled; a light breakpoint is disabled (Figure 9.5).

Once you have some breakpoints in your code, you’ll want to survey and manage them. That’s what the Breakpoint navigator is for. Here you can navigate to a breakpoint, enable or disable a breakpoint by clicking on its arrow in the navigator, and delete a breakpoint.
You can also edit a breakpoint’s behavior. Control-click on the breakpoint, in the gutter or in the Breakpoint navigator, and choose Edit Breakpoint; or Command-Option-click the breakpoint. This is a very powerful facility: you can have a breakpoint pause only under a certain condition or after it has been encountered a certain number of times, and you can have a breakpoint perform one or more actions when it is encountered, such as issuing a debugger command, logging, playing a sound, speaking text, or running a script.
A breakpoint can be configured to continue automatically after performing its action when it is encountered. This can be an excellent alternative to caveman debugging: instead of inserting an NSLog call, which must be compiled into your code and later removed when the app is released, you can set a breakpoint that logs and continues; by definition, such a breakpoint operates only when you’re debugging.
In the Breakpoint navigator, you can create two kinds of breakpoint that you can’t create in the code editor: exception breakpoints and symbolic breakpoints. Click the Plus button at the bottom of the navigator and choose from its pop-up menu.
- Exception breakpoint
- An exception breakpoint causes your app to pause at the time an exception is thrown or caught, without regard to whether the exception would crash your app later. I recommend that you create an exception breakpoint to pause on all exceptions when they are thrown, because this gives the best view of the call stack and variable values at the moment of the exception (rather than later when the crash actually occurs); you can see where you are in your code, and you can examine variable values, which may help you understand the cause of the problem. If you do create such an exception breakpoint, I also suggest that you use the contextual menu to say Move Breakpoint To → User, which makes this breakpoint permanent and global to all your projects.
- Symbolic breakpoint
-
A symbolic breakpoint causes your app to pause when a certain method or function is called, regardless of what object called it or to what object the message is sent. The method or function name may be specified directly; a method may alternatively be specified using the instance method or class method symbol (
-or+) followed by square brackets containing the class name and the method name. For example, to learn where in my app thebeginReceivingRemoteControlEventsmessage was being sent to my shared application instance, I configured a symbolic breakpoint like this:-[UIApplication beginReceivingRemoteControlEvents]
To toggle the active status of breakpoints as a whole, click the Breakpoints button in the project window toolbar, or choose Product → Debug → Activate/Deactivate Breakpoints (Command-Y). The active status of breakpoints as a whole doesn’t affect the enabled or disabled status of any breakpoints; if breakpoints are inactive, they are simply ignored en masse, and no pausing at breakpoints takes place. Breakpoint arrows are blue if breakpoints are active, gray if they are inactive.
When the app runs with breakpoints active and an enabled breakpoint is encountered (and assuming its conditions are met, and so on), the app pauses. In the active project window, the editor shows the file containing the point of execution, which will usually be the file containing the breakpoint. The point of execution is shown as a green arrow; this is the line that is about to be executed (Figure 9.6). Depending on the settings for Running → Pauses in the Behaviors preference pane, the Debug navigator and the Debug pane will also appear.

Here are some things you might like to do while paused at a breakpoint:
- See where you are
-
One common reason for setting a breakpoint is to make sure that the path of execution is passing through a certain line. You can see where you are in any of your methods by clicking on the method name in the call stack, shown in the Debug navigator.
Methods listed in the call stack with a User icon, with the text in black, are yours; click one to see where you are paused in that method. Other methods, with the text in gray, are methods for which you have no source code, so there would be little point clicking one unless you know something about assembly language. The slider in the filter bar hides chunks of the call chain, to save space, starting with the methods for which you have no source.
You can also navigate the call stack using the jump bar at the top of the Debug pane.
- Study variable values
-
This is a very common reason for pausing. In the Debug pane, variable values for the current scope (corresponding to what’s selected in the call stack) are visible in the variables list. You can see additional object features, such as collection elements, instance variables, and even some private information, by opening triangles.
Switch the pop-up menu above the variables list to Auto to see only those variables that Xcode thinks will interest you (because their value has been recently changed, for instance); if you’re after completeness, Local will probably be the best setting. You can use the search field to filter variables by name or value.
In some cases, toggling Show Summmaries in the contextual menu can give a faster or more reliable display of variables. Even with formatted summaries turned off, you can send
descriptionto an object variable and view the output: choose Print Description of [Variable] from the contextual menu. - Set a watchpoint
- A watchpoint is like a breakpoint, but instead of depending on a certain line of code it depends on a variable’s value: the debugger pauses whenever the variable’s value changes. You can set a watchpoint only while paused in the debugger. Control-click on the variable in the variables list and choose Watch [Variable]. Watchpoints, once created, are listed and managed in the Breakpoint navigator.
- Manage expressions
-
An expression is code to be added to the variables list and evaluated every time we pause. Choose Add Expression from the contextual menu in the variables list. The expression is evaluated within the current context in your code, so be careful of side effects! Using
exprin the console or as a breakpoint’s Debugger Command action (see the next paragraph) would be less of a blunt instrument. - Talk to the debugger
-
You can communicate verbally with the debugger in the console. Xcode’s debugger is a front end to an underlying command-line debugger tool (GDB or LLDB). Thus, by talking directly to that command-line tool you can do everything that you can do through the Xcode debugger interface, and more.
A common command is
po(for “print object”) followed by an object variable’s name or a method call that returns an object; it calls the object’sdescriptionmethod, just like NSLog. Another valuable command isexpr, which evaluates an Objective-C expression in the current context — meaning, among other things, that you can call a method, or change the value of a variable in scope! Any such command is also eligible to be used as a breakpoint’s Debugger Command action, meaning that a breakpoint can issue the command automatically.For a good list of other things you’re likely to say, see http://lldb.llvm.org/lldb-gdb.html.
- Fiddle with breakpoints
-
You are free to create, destroy, enable and disable, and otherwise manage breakpoints dynamically even though your app is running, which is useful because where you’d like to pause next might depend on what you learn while you’re paused here.
Indeed, this is one of the main advantages of breakpoints over caveman debugging. To change your caveman debugging, you have to stop the app, edit it, rebuild it, and start running the app all over again. But to fiddle with breakpoints, you don’t have to be stopped; you don’t even have to be paused! An operation that went wrong, if it doesn’t crash your app, can probably be repeated in real time; so you can just add a breakpoint and try again. For example, if tapping a button produces the wrong results, you can add a breakpoint and tap the button again; this time through the same code, you can work out what the trouble is.
- Step or continue
-
To proceed with your paused app, you can either resume running until the next breakpoint is encountered (Product → Debug → Continue) or take one step and pause again. Also, if you hover the mouse over the gutter, a green Continue to Here button appears; pressing this, or alternatively choosing Product → Debug → Continue to Current Line (or Continue to Here in the contextual menu), effectively sets a breakpoint at the chosen line, continues, and removes the breakpoint.
The stepping commands (under Product → Debug) are:
- Step Over
- Pause at the next line.
- Step Into
- Pause in your method that the current line calls, if there is one; otherwise, pause at the next line.
- Step Out
- Pause when we return from the current method.
You can access these commands through convenient buttons at the top of the Debug pane. Even if the Debug pane is collapsed, the part containing the buttons appears while running.
You can also float the project window over everything else on your computer while debugging by choosing Product → Debug Workflow → Xcode Always In Front; after you then switch to the Simulator, you can interact with the Xcode window without giving it focus. If you do want to give it focus, to type in a filter bar for instance, click Focus in the toolbar. This mode of working could be useful while you’re interacting with the Simulator, so as not to have to keep switching between the Simulator and Xcode. To return the project window to its normal state, choose Standard Windowing from the Debugging pop-up menu in the window toolbar (or click Stop in the toolbar to kill the running app).
- Start over, or abort
-
To kill the running app, click Stop in the toolbar (Product → Stop, Command-Period). To kill the running app and relaunch it without rebuilding it, Control-click Run in the toolbar (Product → Perform Action → Run Without Building, Control-Command-R).
You can make changes to your code while the app is running or paused, but those changes are not magically communicated to the running app; there are languages and programming milieus where that sort of thing is possible, but Xcode and Objective-C are not among them. You must stop the app and run in the normal way (which includes building) to see your changes in action.
Note
Clicking the Home button in the Simulator or on the device does not stop the running app in the multitasking world of iOS 4 and later.
Another way of verifying the correctness of your code is through unit tests. A unit test is basically a suite of methods that call methods of your app’s code and use asserts to describe what should happen. Typically, unit tests are constructed so as to confirm not only that the app behaves as expected under normal conditions, but also that incorrect or extreme inputs are handled properly. There’s even a school of thought that suggests you should write unit tests before writing the real code.
The easiest way to attach unit tests to your app is at the time you create the project: in the second dialog, check Include Unit Tests. Xcode endows your project with a secondary target, which is a Unit Testing Bundle consisting of the test code and linked to the SenTestingKit framework. The unit testing target has a dependency on the normal target; thus, if you build the normal target, you build your app normally, but if you build the unit testing target, you build your app along with the unit testing bundle.
To run unit tests against your app, you choose Product → Test. The project’s scheme specifies that this means to build the unit testing target, and lists the test methods that are to be run; to specify particular test methods, edit the scheme.
You can subsequently add another Unit Testing Bundle target to your project if you like. When you do, an additional scheme is created. So, to run the tests in an added unit testing target, you’d change the scheme selection in the Scheme pop-up menu to specify that target, and choose Product → Test. However, adding such targets may require further work on your part: you might have to set up the necessary target dependency, edit the scheme, and adjust the target membership of your app’s class files. The details can be tricky: see Setting Up Application Unit Tests in Apple’s Xcode Unit Testing Guide.
For more information about unit testing, see Apple’s Xcode Unit Testing Guide. The appendix to that document lists the SenTestingKit assert functions (actually macros) that you can use.
From time to time, you should use the static analyzer to look for possible sources of error in your code; choose Product → Analyze (Shift-Command-B). This command causes your code to be compiled, and the static analyzer studies it and reports its findings in the Issue navigator and in your code.
The static analyzer is static (it’s analyzing your code, not debugging in real time), but it is remarkably intelligent and may well alert you to potential problems that could otherwise escape your notice. You might think that the compiler — including ARC, if you’re using it — knows all there is to know about your code; and it is certainly true that one of the main reasons for using the static analyzer, namely, to assist with manual memory management of Objective-C instances, is essentially gone if you’re using ARC. Still, the static analyzer actually studies the possible values and paths of execution in your code, and can detect potential sources of trouble in your program’s logic that no mere compiler would worry about. For example, in this code, the static analyzer knows that i in the second line is uninitialized:
int i;
if (i) NSLog(@"here");
In this code, the static analyzer knows that the second line throws away the existing value of i without that value ever having been read:
int i=0;
i=1;
Those are tiny problems, but they illustrate how, in a complex program, the static analyzer is capable of noticing possible sources of trouble and bringing them to your attention. For more about the static analyzer, see http://clang-analyzer.llvm.org.
From time to time, during repeated testing and debugging, and before making a different sort of build (switching from Debug to Release, or running on a device instead of the Simulator), it is a good idea to clean your target. This means that existing builds will be removed and caches will be cleared, so that all code will be considered to be in need of compilation and the next build will build your app from scratch.
The first build of your app after you clean will take longer than usual. But it’s worth it, because cleaning removes the cruft, quite literally. For example, suppose you have been including a certain resource in your app, and you decide it is no longer needed. You can remove it from the Copy Bundle Resources build phase (or from your project as a whole), but that doesn’t remove it from your built app. Only cleaning will do that, because it removes the built app completely.
To clean, choose Product → Clean. For more complete cleaning, hold Option to get Product → Clean Build Folder.
In addition, Xcode stores builds and project indexes in ~/Library/Developer/Xcode/DerivedData. From time to time, with Xcode not running, I like to move the contents of that folder to the trash. This is effectively a massive and even more complete clean of every project that you’ve opened recently. Alternatively, to trash the folder in DerivedData for a single project from within Xcode, switch to the Projects tab of the Organizer window (Window → Organizer), select the project at the left, and click the Delete button next to the Derived Data listing at the top of the window. A project will take longer to open for the first time afterward, because its index must be rebuilt, and it will take longer to build, because its build information has been removed. But the space savings on your hard disk can be significant, and forcing the index to rebuild itself can actually ward off certain problems.
You should also from time to time remove all versions of your built app from the Simulator cache. Choose iOS Simulator → Reset Content and Settings. Alternatively, you can clean the Simulator cache by hand. To do so, first quit the Simulator if it’s running. Then find the cache in ~/Library/Application Support/iPhone Simulator, followed by the system version of the SDK (for example, there might be a folder called 6.1); within this, find the Applications folder, and move the contents of that folder to the trash. If there are multiple system version folders here, you might want to jettison the contents of the Applications folders of all of them.
When you build and run with the Simulator as the destination, you run in the iOS Simulator application. The Simulator window represents a device. If your app runs on either iPhone or iPad (natively or in the iPhone emulator), you can choose which device is simulated as you choose your destination; similarly, if your app runs on multiple system versions, you can choose the system version of the simulated device as you choose your destination. (See Chapter 6 on destinations, and the first section of this chapter on device architectures and the Deployment Target build setting.)
You can also switch device types by choosing Hardware → Device in the Simulator. This quits your app running in the Simulator; you can relaunch it by building and running in Xcode again, or by clicking your app’s icon in the Simulator. In the latter case there is no longer any connection to Xcode (you aren’t using the debugger, so you won’t stop at breakpoints, and log messages won’t be relayed to the Xcode console); still, you might do this just to check quickly on how your app looks or behaves on a different device.
The one key choice you can make using Hardware → Device in the Simulator that you can’t make by choosing a destination in Xcode is between iPad and iPad (Retina), or between iPhone, iPhone (Retina 3.5-inch), and iPhone (Retina 4-inch):
- The Retina display is a double-resolution screen, so it can be displayed at double size, with each pixel of the Retina display corresponding to a pixel of your computer’s monitor.
- The Retina 4-inch display is the size of the iPhone 5 and 5th-generation iPod touch screen, as opposed to the Retina 3.5-inch screen, which is the size of the iPhone 4 and 4S, as well as the 4th-generation iPod touch. The Retina 3.5-inch screen is the double-resolution version of the screens of all earlier single-resolution iPhones and iPod touches.
Changing this setting quits your app running in the Simulator, but your choice will stick if you return to Xcode and build and run on iPhone again.
The Simulator window can be displayed at half, three-quarter, or full size (choose from Window → Scale). This is a matter of display merely, comparable to zooming the window, so your app running in the Simulator does not quit when you change this setting. For example, you might run a Retina device in the Simulator at full size to see every double-resolution pixel, or at half size to save space.
You can interact with the Simulator in some of the same basic ways as you would a device. Using the mouse, you can tap on the device’s screen; hold Option to make the mouse represent two fingers and Option-Shift to move those fingers in parallel. Some Simulator representations display a Home button, which you click with the mouse, but the most reliable way to click the Home button is to choose Hardware → Home (Shift-Command-H). Menu items also let you perform hardware gestures such as rotating the device, shaking it, and locking its screen; you can also test your app by simulating certain rare events, such as a low-memory situation (and this is a useful thing to do from time to time; I’ll talk more about it in Chapter 19).
The Debug menu in the Simulator is useful for detecting problems with animations and drawing. You can choose from this menu while your app is running in the Simulator, without causing the app to quit. Toggle Slow Animations is unique to the Simulator; it makes animations unfold in slow motion so that you can see just what’s happening (animation is discussed in Chapter 17). The other four menu items represent features that were previously available only when running on a device using Instruments (mentioned later in this chapter), under the Core Animation instrument; now they are rolled directly into the Simulator as well.
I’ll return to the specifics of what these menu items do when discussing drawing (Chapter 15) and layers (Chapter 16); but here’s an example you can try immediately. Return to the Empty Window project developed in Chapter 7. In AppDelegate.m, we are pulling a label out of a nib and putting it into our interface by setting its center, like this:
[self.window.rootViewController.view addSubview: lab];
lab.center = CGPointMake(100,100);
lab.frame = CGRectIntegral(lab.frame);
If you comment out that last line, run the project in the Simulator with the device set to iPhone — not iPhone (Retina) — and toggle on Debug → Color Misaligned Images, you may see the label painted with a magenta overlay. That’s because, without the call to CGRectIntegral, the label is misaligned; by default, the label is 21 points high, which is an odd number, so setting its center to an integral point value has caused its vertical position to be halfway between two integer pixel values on the device. The effect of this misalignment is actually visible to the naked eye if you know what to look for: the text looks fuzzy or bold. Using Debug → Color Misaligned Images alerts you to the issue; calling CGRectIntegral fixes it.
The Debug menu also contains some items that are useful when you’re testing an app that uses Core Location (discussed in Chapter 35).
Sooner or later, you’re going to want to switch from running and testing and debugging in the Simulator to running and testing and debugging on a real device. The Simulator is nice, but it’s only a simulation; there are many differences between the Simulator and a real device. The Simulator is really your computer, which is fast and has lots of memory, so problems with memory management and speed won’t be exposed until you run on a device. User interaction with the Simulator is limited to what can be done with a mouse: you can click, you can drag, you can hold Option to simulate use of two fingers, but more elaborate gestures can be performed only on an actual device. And many iOS facilities, such as the accelerometer and access to the music library, are not present on the Simulator at all, so that testing an app that uses them is possible only on a device.
Warning
Don’t even think of developing an app without testing it on a device. You have no idea how your app really looks and behaves until you run it on a device. Submitting to the App Store an app that you have not run on a device is asking for trouble.
Before you can run your app on a device, even just to test, you must join the iOS Developer Program by paying the annual fee. (Yes, this is infuriating. Now get over it.) Only in this way can you obtain and provide to Xcode the credentials for running on a device. Once you have joined the iOS Developer Program, obtaining these credentials involves use of the iOS Provisioning Portal, which is accessed online, through your web browser (or, for certain actions, through Xcode itself).
Note
To reach the iOS Provisioning Portal in your browser (once you’re an iOS Developer Program member), go to http://developer.apple.com/devcenter/ios. Click Log In to log in, and then click iOS Provisioning Portal at the upper right.
You will need to perform the following initial steps once:
- Join the iOS Developer Program (http://developer.apple.com/programs/ios). This requires filling out a form and paying the annual fee. Unless you have multiple developers, all of whom might need to build and run on their own devices, the Individual program is sufficient. The Company program costs no more, but adds the ability to privilege additional developers in various roles. (You do not need the Company program just in order to distribute your built app to other users for testing.)
- Obtain a development certificate that identifies and authorizes your computer. This is the computer to which you’ll be attaching the device so you can run on it. Basically, this certificate matches the person who uses your computer to the person interacting with the iOS Provisioning Portal. The certificate will be stored in your computer’s keychain, where Xcode will be able to see it automatically.
The certificate depends upon a private–public key pair. The private key will live in your keychain; the public key will be handed over to the iOS Provisioning Portal, to be built into the certificate. The way you give the Portal your public key is through a request for the certificate. So, you generate the private–public key pair; your keychain keeps the private key; the public key goes into the certificate request; you submit the request, containing the public key, to the Portal; and the Portal sends back the certificate, also containing the public key, which also goes into your keychain, where it is matched with the private key, thus ensuring that you are you.
Detailed instructions for generating the private–public key pair and the certificate request are available once you’ve joined the iOS Developer Program and have logged in at Apple’s developer site. (The process is described at http://developer.apple.com/ios/manage/certificates/team/howto.action. A video review of the steps involved is available to anyone at http://developer.apple.com/ios/videos/popupcerts.action.) Basically, you start up Keychain Access and choose Keychain Access → Certificate Assistant → Request a Certificate from a Certificate Authority. Using your name and email address as identifiers, you generate and save to disk a 2048-bit RSA certificate request file. Your private key is stored in your keychain then and there; the certificate request contains your public key.
You then go to the iOS Provisioning Portal in your browser. At the Portal, upload the certificate request file using the Development (not Distribution!) tab of the Certificates section. You may have to approve your own request, and you may have to refresh that web page to see the Download button.
Note
If this is your very, very first time obtaining any certificate from the Portal, you will need another certificate: the WWDR Intermediate Certificate. This is the certificate that certifies that certificates issued by WWDR (the Apple Worldwide Developer Relations Certification Authority) are to be trusted. (You can’t make this stuff up.) You’ll see a link for this intermediate certificate; click it to download the intermediate certificate. Double-click the intermediate certificate file; it is imported by your keychain. You can then throw the file away.
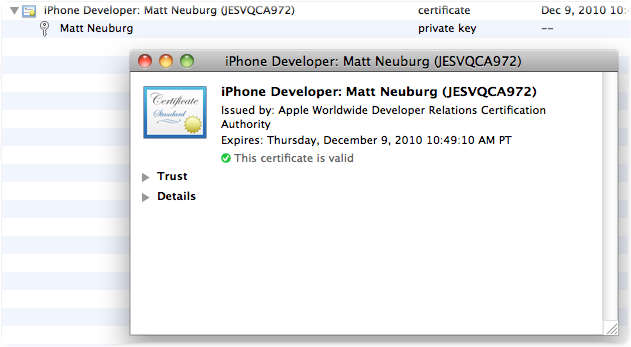
When the development certificate itself is ready, you download it and double-click it; Keychain Access automatically imports the certificate and stores it in your keychain. You do not need to keep the certificate request file or the development certificate file; your keychain now contains all the needed credentials. If this has worked, you can see the certificate in your keychain, read its details, and observe that it is valid and linked to your private key (Figure 9.7).
With your development certificate in place, you need to register a device for development use, meaning that you’ll be able to build and run from Xcode onto that device rather than the Simulator. This can be done entirely from within Xcode. Open the Organizer window (Window → Organizer) and switch to the Devices tab. Select Provisioning Profiles under Library at the left, and make sure Automatic Device Provisioning is checked at the bottom of the window. Attach your device to the computer; the device name appears at the left under Devices. Select it, and click Use For Development. You’ll be asked for your Portal username and password. Xcode connects to the Portal via the Internet and does two things:
- It registers your device at the Portal by its name and unique identifier number. You could have done this yourself in your browser (at the Portal, under Devices), but this way it is done for you.
-
It creates and downloads from the Portal a universal development provisioning profile (referred to as a team provisioning profile) for development on this device. This is something you can’t do at the Portal yourself. A development provisioning profile created manually at the Portal applies to a single app; in the past, when the Portal was the only way to obtain a development provisioning profile, you had to generate a new development provisioning profile for each app you wanted to test on a device, which was very inconvenient. But the team provisioning profile generated by Xcode applies to all apps. The team provisioning profile appears in the Organizer, under Provisioning Profiles; you can identify it because it is called iOS Team Provisioning Profile and has an app identifier consisting of just a key and an asterisk, like this:
B398E68A3D.*.
If your device is already registered at the Portal but Use For Development doesn’t appear in Xcode and you’ve no team provisioning profile, go back to Provisioning Profiles under Library and click Refresh at the bottom right of the window. The team provisioning profile will be regenerated. If you later add further devices for development (Use for Development) and you already have a team provisioning profile, they will be added to it automatically, within Xcode.
Note
If you develop an app that uses certain specialized features, such as push notifications (Chapter 37), iCloud (Chapter 36), or in-app purchases, you must generate a development provisioning profile the old way, manually at the Portal, in order to obtain the necessary entitlements. To do so, first enter your app by name and bundle id in the App IDs section of the Portal. Now go to Provisioning and the Development section and generate a new provisioning profile, specifying that app and your device(s). You can then download the provisioning profile in the Organizer window, under Provisioning Profiles, by clicking the Refresh button.
You now have a development provisioning profile in Xcode (the team provisioning profile). You can install this provisioning profile onto your device manually in the Organizer window by dragging its listing (under Provisioning Profiles) onto the device’s name (under Devices) when the device is connected. Alternatively, you can just start building and running on the device. Start with a project window. With the device attached to the computer, pick the destination in the Scheme pop-up menu corresponding to your device; then build and run. If Xcode complains that your device doesn’t contain a copy of the provisioning profile, and offers to install it for you, accept that offer.
The app is built, loaded onto your device, and runs. As long as you launch the app from Xcode, everything is just as when running in the Simulator: you can run, or you can debug, and the running app is in communication with Xcode, so that you can stop at breakpoints, read messages in the console, and so on. The outward difference is that to interact physically with the app, you use the device (attached to your computer), not the Simulator.
Your central location for surveying provisioning profiles, identities (certificates) and devices is the Devices tab of the Organizer window (Window → Organizer). Under Library, select Provisioning Profiles for a list of profiles. Under Teams, you’ll see a list of your developer identities and their associated certificates.
As someone with more than one computer, I find the coolest feature of this interface to be the Export button at the bottom of the window. When you click it, you’re asked for a password (twice), which can be anything you like; it outputs a .developerprofile file. On another computer, run Xcode and double-click that .developerprofile file in the Finder. Xcode asks for a password. Enter the same password you gave previously, and like magic the entire suite of teams and identities and certificates and provisioning profiles springs to life in that other copy of Xcode, including the entries in your keychain.
When a device is attached to the computer, it is listed with a green dot under Devices. Click its name to access information on the device. You can see the device’s unique identifier. You can see provisioning profiles that have been installed on the device. You can view the device’s console log in real time, just as if you were running the Console application to view your computer’s logs. You can see log reports for crashes that took place on the device. And you can take screenshots that image your device’s screen; you’ll need to do this for your app when you submit it to the App Store. Device logs and screenshots are also available under Library.
Various systems of version control exist for taking periodic snapshots (technically called commits) of your project. The value of such a system to you will depend on what system you use and how you use it; for example, you might use version control because it lets you store your commits in a repository offsite, so that your code isn’t lost in case of a local computer glitch or some equivalent “hit by a bus” scenario, or because it allows multiple developers to access the same code.
To me, personally, the chief value of version control is freedom from fear. Having version control actually changes the way I program. A project is a complicated thing, consisting of numerous files. Often, changes must be made in many files before a new feature can be tested. Thus it is all too easy to start down some virtual road involving creating or editing multiple files, only to find yourself at the end of a blind alley and needing to retrace your steps. Version control means that I can easily retrace my steps; I have but to say, in the language of some version control system I’ve been using, “Forget everything I just did and return the whole project to where it was at such-and-such a commit.” I rarely, if ever, in fact retrace my steps, but the knowledge that I could do so gives me the courage to try some programming strategy whose outcome may not be apparent until after many days of effort. Also, I can ask a version control system, “What the heck are all the changes I’ve made since the last commit?” In short, without version control I’d be lost, confused, hesitant, rooted to the spot, paralyzed with uncertainty; with it, I forge boldly ahead and get things done. For this reason, my current personal favorite version control system is git (http://git-scm.com), whose agile facilities for managing branches give me tremendous license to experiment.
Xcode provides various version control facilities. Starting with Xcode 4, those facilities concentrate on git and Subversion (http://subversion.apache.org). This doesn’t mean you can’t use any other version control system with your projects! It means only that you can’t use any other version control system in an integrated fashion from inside Xcode. Personally, I don’t find that to be any kind of restriction. For years I’ve used Subversion, and more recently git, on my Xcode projects from the command line in Terminal, or through specialized third-party GUI front ends such as svnX for Subversion (http://www.lachoseinteractive.net/en/products) or SourceTree for git (http://www.sourcetreeapp.com). I’m comfortable and nimble at the command line, and access to version control from within Xcode itself is not a priority for me.
At the same time, version control integration in Xcode 4 is greatly improved and far more extensive than previously:
- Automatic git repository creation
- When you create a new project, the Save dialog includes a checkbox that offers to place a git repository into your project folder from the outset.
- Automatic repository detection
- When you open an existing project, if that project is already managed with Subversion or git, Xcode detects this and is ready instantly to display version control information in its interface.
- Version comparison
-
The Version editor (View → Version Editor → Show Version Editor, or click the third button in the Editor segmented control in the project window toolbar) includes a view similar to that of the File Merge utility, graphically displaying the differences between versions of a file. For example, in Figure 9.8, I can see that in the more recent version of this file (on the left) I’ve changed
representativeItemtoitems[0]. The Version editor also includes various ways to survey and navigate versions and commit logs. For example, if I switch to Blame view I can see my own commit message explaining the change I just mentioned: “Stop usingrepresentativeItem, in order to avoid nasty log messages (reported to Apple).”
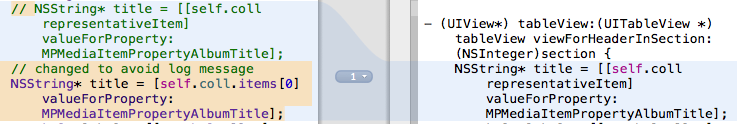
Without minimizing these features, I don’t rely on them exclusively or even primarily (although I certainly take advantage of them where convenient). I find version control management through the command line far easier and clearer for many purposes, and Xcode doesn’t come close to the command line’s power, especially for managing branches; Xcode has nothing like the visual branch representation of git’s own gitk tool; and Xcode’s repository management in the Organizer window is downright crude. In addition, as of this writing, Xcode’s git integration is fundamentally flawed: if I create a new file in a git-controlled project, Xcode adds it to the staging area (the git index) rather than letting me compose the commit in my own way, so that I typically have to switch to the command line and say git reset to fend off Xcode’s interference.
Version control in general is a large and complicated topic. Use and configuration of any version control system can be tricky and scary at first and always requires some care. So I’m deliberately not going to say anything specific about it; I’m mentioning it at all only because version control of some sort is in fact likely, sooner or later, to play a role in the life cycle of your projects. When it does, you’ll want to read up on the use of your chosen version control system, along with “Save and Revert Changes to Projects” in the Xcode 4 User Guide. You’ll find Xcode’s integrated version control facilities in three chief locations:
- The File menu
- The relevant menu items are all under File → Source Control. The most frequently used commands are Add and Commit on the one hand, and Discard Changes on the other. You can go a very long way with elementary use of git through just those three menu items.
- The Version editor
- Choose View → Version Editor → Show Version Editor, or click the third button in the Editor segmented control in the project window toolbar.
- The Organizer
- The Repositories tab of the Organizer window lists known repositories and branches for each project, along with their commit logs. Also, use the Plus button at the bottom of the navigator to enter data about a remote repository, so that you can obtain a copy of its contents.
Xcode also contains its own way of taking and storing a snapshot of your project as a whole; this is done using File → Create Snapshot (and, according to your settings, some mass operations such as find-and-replace or refactoring may offer to take a snapshot first). Snapshots themselves are managed in the Projects tab of the Organizer window. Although these snapshots are not to be treated as full-fledged version control, they are in fact maintained as git repositories, and can certainly serve the purpose of giving confidence in advance of performing some change that might subsequently engender regret. You can manage snapshots in the Projects tab of the Organizer window; here you export a snapshot, thus resurrecting an earlier state of your project folder.
As your app approaches completion, you may wish to fine-tune it for memory usage, speed, and other real-time behavior. Xcode provides a sophisticated and powerful utility application, Instruments, that lets you collect profiling data on your app as it runs. The graphical display and detailed data provided by Instruments may give you the clues you need to optimize your app.
You can use Instruments on the Simulator or the device. The device is where you’ll do your ultimate testing, and certain instruments (such as Core Animation) are available only for the device; on the other hand, certain other instruments (such as Zombies) are available only in the Simulator.
To get started with Instruments, set the desired destination in the Scheme pop-up menu in the project window toolbar, and choose Product → Profile. (For memory usage, your destination can be the Simulator, but for most other forms of analysis, you’ll want to run on a device to achieve maximum verisimilitude.) Your app builds using the Profile action for your scheme; by default, this uses the Release build configuration, which is probably what you want. If you’re running on a device, you may see some validation warnings, but you can safely ignore them. Instruments launches; if your scheme’s Instrument pop-up menu for the Profile action is set to Ask on Launch (the default), Instruments presents a dialog where you choose a trace template. If you’re running on the Simulator, you might have to pass through an authorization dialog the first time you use Instruments. With Instruments running, you should interact with your app like a user; Instruments will record its statistics. Once Instruments is running, it can be further customized to profile the kind of data that particularly interests you, and you can save the structure of the Instruments window as a custom template.
Use of Instruments is an advanced topic and beyond the scope of this book. Indeed, an entire book could (and really should) be written about Instruments alone. For proper information, you should read Apple’s documents, especially the Instruments User Reference and Instruments User Guide. Also, many WWDC videos from current and prior years are about Instruments; look for sessions with “Instruments” or “Performance” in their names. Here, I’ll just demonstrate, without much explanation, the sort of thing Instruments can do.
I’ll start by charting the memory usage of my TidBITS News app as it starts up and the user proceeds to work with it. Memory is a scarce resource on a mobile device, so it’s important to be certain that we’re not hogging too much of it. I’ll set the destination to the Simulator and choose Product → Profile; Instruments launches, and I’ll choose the Allocations trace template and click Profile. My app starts running in the Simulator, and I work with it for a while and then pause Instruments, which meanwhile has charted my memory usage (Figure 9.9). Examining the chart, I find there are a couple of spikes early on, first as the app launches and then as the app downloads and parses an RSS feed; but it’s only 5.40 MB at its maximum, and the app settles down to use slightly over 2 MB pretty steadily thereafter. These are very gentle memory usage figures, so I’m happy.
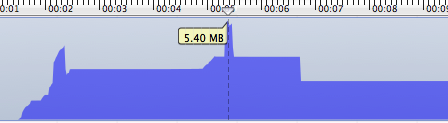
Another field of Instruments expertise is the ability to detect memory leaks. Memory leaks, discussed further in Chapter 12, remain possible even under ARC. In this trivial example, I have two classes, MyClass1 and MyClass2; MyClass1 has an ivar property which is a MyClass2 instance, and MyClass2 has an ivar property which is a MyClass1 instance. The app runs this code:
MyClass1* m1 = [MyClass1 new];
MyClass2* m2 = [MyClass2 new];
m1.ivar = m2;
m2.ivar = m1;
There are steps I could have taken to prevent this from being a memory leak, as I’ll explain in Chapter 12; but I haven’t taken those steps, so it is a memory leak. I’ll set the destination to the Simulator and choose Product → Profile; Instruments launches, and I’ll choose the Leaks trace template and click Profile. My app starts running in the Simulator, and after about 10 seconds (the default interval at which Instruments runs its leak analysis), a leak is detected. After some appropriate button-pushing, I’m actually shown a diagram of the mistake that’s causing this leak (Figure 9.10)!
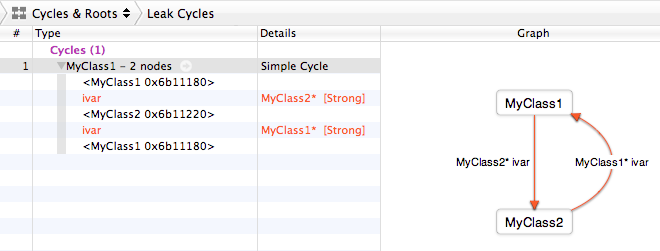
In this final example, I’m concerned with what’s taking my Albumen app so long to switch from master view to detail view. I’ll set the destination to a device, because that’s where speed matters and needs to be measured, and choose Product → Profile; Instruments launches, and I’ll choose the Time Profiler trace template and click Profile. The master view appears; I’ll tap a cell in the table view, and after a significant delay, the detail view appears. Now I’ll pause Instruments and look at what it’s telling me.
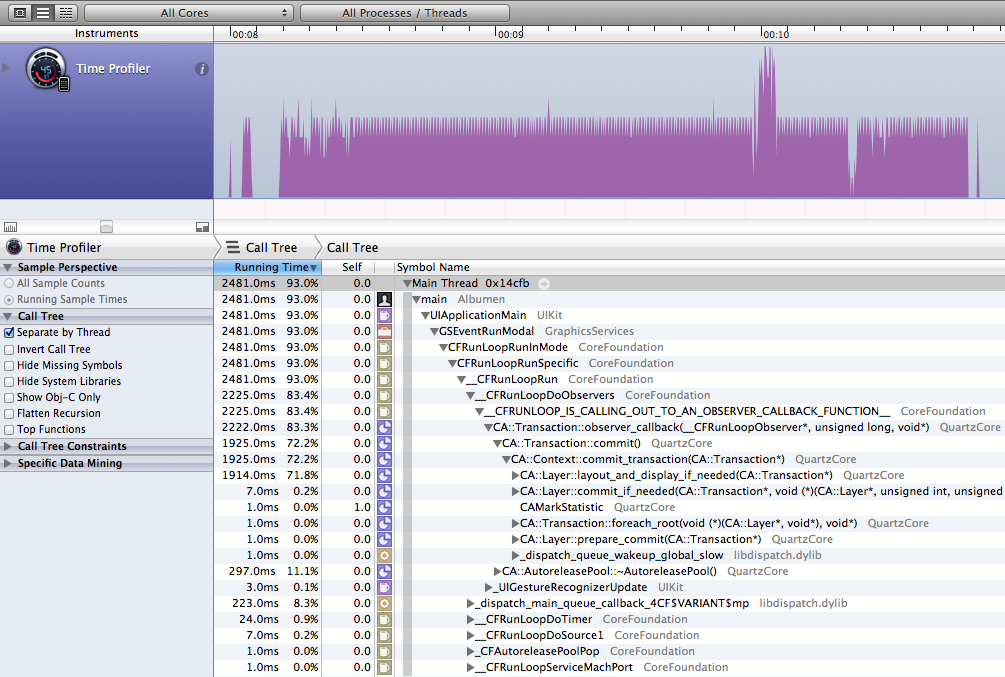
As we can see from Figure 9.11, this transition is taking nearly three seconds. Opening the triangles in the lower portion of the window, it turns out that much of this is spent in something described as CA::Layer::layout_and_display_if_needed. That’s not my code; it’s deep inside Cocoa. But by clicking the little arrow that appears to the right of that line when I hover the mouse over it, I can see the call stack and discover how my code is involved in this call (Figure 9.12).
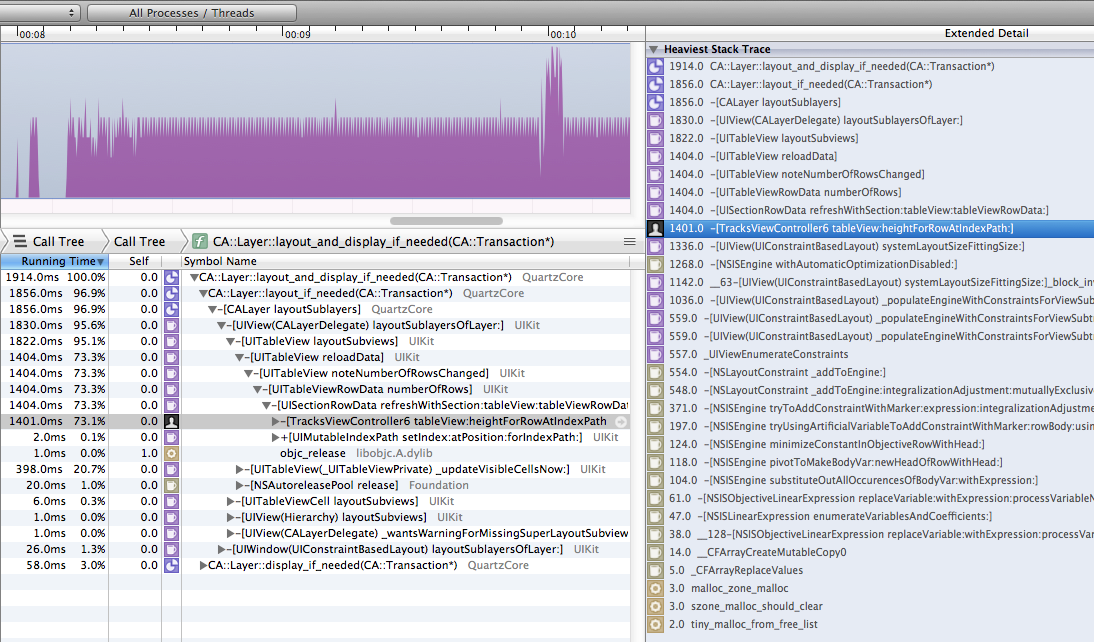
One line of my code is involved in this call: tableView:heightForRowAtIndexPath:. This is where we work out the heights of the table view cells to be shown in the detail view. By double-clicking the listing of that line, I can see my own code, time-profiled (Figure 9.13).
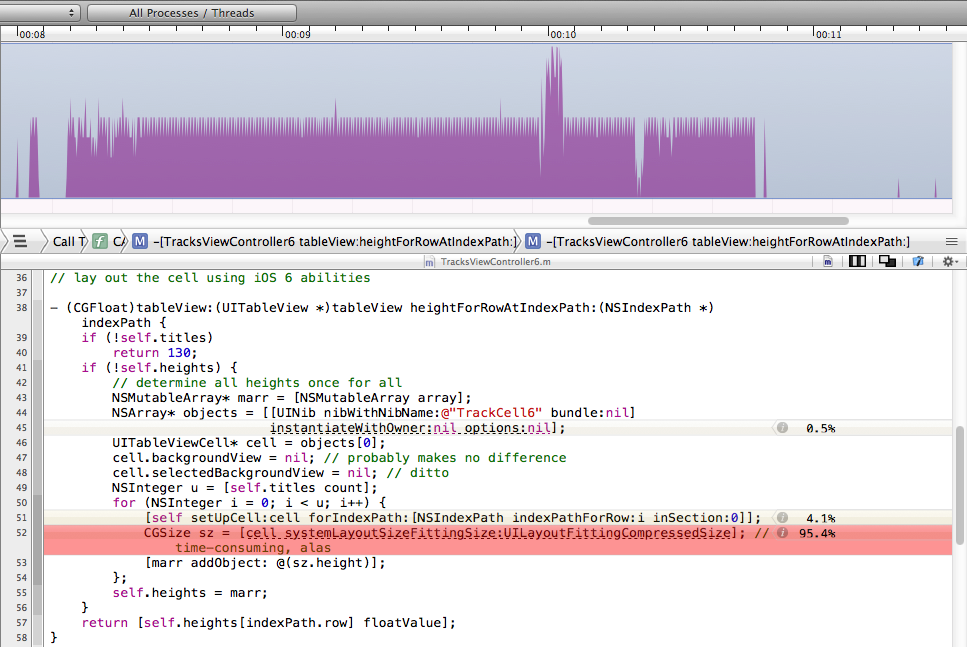
This is really useful information. It’s also fairly depressing. The bulk of the time is being spent in Cocoa’s systemLayoutSizeFittingSize:. That call is how I calculate the height of the table view cell using iOS 6’s new autolayout feature (Chapter 21). This approach is working perfectly, but clearly it is relatively expensive.
It is a programming proverb that one should not optimize prematurely; equally, one should not spend time optimizing when the resulting savings will make no perceptible difference to the user. I know how I used to calculate the table view cell height before iOS 6; it was much less elegant, but it was faster — and I can prove this quantitatively through further measurement, analysis, and experimentation. That’s exactly the value of Instruments: for guesswork and impressions, it substitutes actual numbers and facts. Unfortunately, Instruments can’t tell me how to make the trade-off between the increased speed of the old approach and the greater elegance and reliability of the new approach.
By distribution is meant providing your app to others who are not developers on your team. There are two kinds of distribution:
- Ad Hoc distribution
- You are providing a copy of your app to a limited set of known users so that they can try it on their devices and report bugs, make suggestions, and so forth.
- App Store distribution
- You are providing the app to the App Store so that anyone can download it (possibly for a fee) and run it.
Warning
The Portal imposes a registration limit of 100 devices per year per developer (not per app), which limits your number of Ad Hoc testers. Your own devices used for development are counted against this limit.
To perform any kind of distribution, you will need a distribution certificate, which is different from the development certificate discussed earlier in this chapter. Like the development certificate, you need only one distribution certificate; it identifies you as you. Obtaining a distribution certificate is exactly like obtaining a development certificate, except that, at the iOS Provisioning Portal, under Certificates, you use the Distribution tab instead of the Development tab.
You will also need a distribution profile specifically for this app, which is different from the development profile you obtained earlier. You can’t obtain a distribution profile from within Xcode; you must get it at the Portal in your browser. You might need two distribution profiles, because the profile for an Ad Hoc distribution is different from the profile for an App Store distribution. Remember, you will need a separate set of distribution profiles for each app you plan to distribute.
When you build for distribution, you’ll use the Product → Archive command. Indeed, you can think of archive as meaning “build for distribution.” However, you have some preparation to do before you can archive in such a way as to make an app you can actually distribute. If you look at the Archive action in your default scheme, you’ll discover that it is set to use the Release distribution configuration. But if you examine the Code Signing Identity build setting for your project, you’ll see that by default it uses a development profile (most likely the team development profile). This won’t do; when you intend to distribute a copy of your app, you want to use a distribution profile. The solution I recommend is to create a third build configuration called Distribution; you can then set the Archive action in your scheme to use the Distribution build configuration, and set the Code Signing Identity build setting to use the distribution profile when the Distribution build configuration is in force.
First, here are the steps for obtaining a distribution profile:
- To obtain an Ad Hoc distribution profile, collect the unique identifiers of all the devices where this build is to run, and add each of the device identifiers at the Portal under Devices. (For an App Store profile, omit this step.)
- In the Portal, in the Distribution (not Development!) tab of the Provisioning section, ask for a New Profile. In the New Profile form, ask for an Ad Hoc profile or an App Store profile, depending on which you’re after.
- Describe the profile, giving it a name, and specifying your distribution certificate and this app. For an Ad Hoc profile, also specify all the devices you want the app to run on. Be careful about the profile’s name, as you will need to be able to identify it later from within Xcode! My own practice is to assign a name containing both the name of the app and the term “adhoc” or “appstore”.
- Click Submit to generate the profile; you might then have to refresh the browser window to see the Download button next to your new profile. Download the profile and drag it onto Xcode’s icon in the Dock. You can now throw the profile away in the Finder; Xcode has kept a copy (which should appear in the Organizer window).
Now here are the steps to create and use a Distribution build configuration for your project:
- Edit the project. In the Info tab, click the Plus button below the list of configurations, and duplicate the Release configuration. Name the new configuration Distribution.
- Edit the project (still). In the Build Settings tab, locate the Code Signing Identity entry. The Distribution build setting is now listed here, with a subentry Any iOS SDK. Set the value of this subentry to the appropriate distribution profile for this app.
- Edit the scheme, and switch to the Archive action. Change the build configuration to Distribution, and click OK.
The result is that from now on, when you choose Build → Archive, you’ll use a distribution profile associated with this app. That means you’ll be able to distribute the archived app.
To create and distribute an Ad Hoc distribution build, first switch to the iOS Device destination in the Scheme pop-up menu in the project window toolbar. Until you do this, the Product → Archive menu item will be disabled. You do not have to have a device connected; you are not building to run on a particular device, but to save an archive.
Apple’s docs say that an Ad Hoc distribution build should include an icon that will appear in iTunes, but my experience is that this step is unnecessary. If you want to include this icon, it should be a PNG or JPEG file, 512×512 pixels in size, and its name should be iTunesArtwork, with no file extension. Make sure the icon is included in the build, being present in the Copy Bundle Resources build phase.
Now choose Product → Archive. The build is created and copied into a date folder within ~/Library/Developer/Xcode/Archives; it also appears in the Organizer window in the Archives tab. Locate the archive in the Organizer window. You can add a comment here; you can also change the archive’s name (this won’t affect the name of the app).
Note
If Xcode refuses to build because of a Code Sign error, it may help to close the project window and delete this project’s entire build folder from the DerivedData directory, as described earlier in this chapter. When you reopen the project, after Xcode has finished reindexing it, check the build settings for your Distribution configuration; it may help to set once again the value of Any iOS SDK for the Distribution configuration under Code Signing Identity. See also Apple’s tech note TN2250, “Understanding and Resolving Code Signing Issues.”
Select the archive and press the Distribute button at the upper right of the window. A dialog appears. Here, you are to specify a procedure; choose Save for Enterprise or Ad-Hoc Deployment. You are now asked to choose a code signing identity; specify the identity associated with the Ad Hoc distribution profile for this app. Click Next.
After a while, a Save dialog appears. Give the file a useful name; this won’t affect the name of the app. Save the file to disk. It will have the suffix .ipa (“iPhone app”).
Locate in the Finder the file you just saved. Provide this file to your users with instructions. A user should copy the .ipa file to a safe location, such as the Desktop, and then launch iTunes and drag the .ipa file from the Finder onto the iTunes icon in the Dock. Then the user should connect the device to the computer, make certain the app is present and checked in the list of apps for this device, and sync the device to cause the app to be copied to it. (If this isn’t the first version of your app that you’ve distributed to your ad hoc testers, the user might need to delete the current version from the device beforehand; otherwise, the new version might not be copied to the device when syncing.)
If you listed your own device as one of the devices for which this Ad Hoc distribution profile was to be enabled, you can obey these instructions yourself to make sure the Ad Hoc distribution is working as expected. First, remove from your device any previous copies of this app (such as development copies) and any profiles that might be associated with this app (in the Settings app, under General → Profiles). Then copy the app onto your device by syncing with iTunes as just described. The app should run on your device, and you should see the Ad Hoc distribution profile on your device (in the Settings app). Because you are not privileged over your other Ad Hoc testers, what works for you should work for them.
As the big day approaches when you’re thinking of submitting your app to the App Store, don’t let the prospect of huge fame or massive profits hasten you past the all-important final stages of app preparation. Apple has a lot of requirements for your app, such as icons and launch images, and failure to meet them can cause your app to be rejected. Take your time. Make a checklist and go through it carefully. See the iOS Application Programming Guide for full details.
At various stages, you can obtain validation of your app to confirm that you haven’t omitted certain requirements. For example, by default, a new project’s Release build configuration has the Validate Build Product build setting set to Yes. Thus, when I do a build of the Empty Window app we’ve developed in previous chapters, if that build uses the Release build configuration (or the Distribution build configuration duplicated from it), Xcode warns that the app has no icon. When you submit your app to the App Store, it will be subjected to even more rigorous validation.
An icon file must be a PNG file, without alpha transparency. It should be a full square, without shading (the “shine” effect that you see in the upper part of icons on your device); the rounding of the corners and shine will be added for you. You can prevent the shine effect from being added to the icon for your App Store build by defining and checking the “Icon already includes gloss and bevel effects” key (UIPrerenderedIcon) in your Info.plist.
On a device, the system uses the “Icon files” key in your app’s Info.plist file to locate your icons, and it decides which icon to use under what circumstances by examining their sizes. Therefore, these sizes must be exactly correct. The required sizes for current systems and devices are as follows:
- For an iPhone app, there should be two primary app icons, one 57×57 pixels, the other 114×114 pixels (for use on the double-resolution Retina display).
- For an iPad app, there should be two primary app icons, one 72×72 pixels, the other 144×144 pixels (for use on the double-resolution Retina display).
A double-resolution variant of an icon should have the same name as the single-resolution variant, except for the addition of @2x to its name. A universal app will need all four icons.
To add your icons, edit the target and drag-and-drop each icon into the appropriate space in the Summary tab. Xcode will incorporate the icons into the project and the target and configure your Info.plist for you. For example, if I drop a 57×57 PNG file called myDumbIcon.png onto the first iPhone icon space, it is copied into the project and added to the target. In my Info.plist, the result is a structure as follows:
Icon files (iOS 5)  (Dictionary)
  Primary Icon      (Dictionary)
    Icon files      (Array)
      Item 0        myDumbIcon.png
Other icons can be added to the “Icon files” array. (The reason for this rather convoluted structure is so that Newsstand apps can include a separate Newsstand icon.) Alternatively, you can specify the icon file(s) manually. You will then have to take upon yourself the responsibility for making sure that each icon file is part of the target and the Copy Bundle Resources build phase, and you’ll have to edit Info.plist yourself.
Optionally, you may elect to include smaller versions of your icon to appear when the user does a search on the device, as well as in the Settings app, if you include a settings bundle (Chapter 36). The smaller icon sizes are 29×29 (and 58×58 pixels for its double-resolution partner) for iPhone search results and the Settings bundle, and 50×50 (and 100×100 for its double-resolution partner) for iPad search results. Follow the instructions in the previous paragraph for specifying these icon files manually. However, I never include these icons, and no ill consequences have accrued.
Warning
The difficulty of getting the required icon sizes right is greatly increased by the proliferation of outdated information throughout Apple’s own documentation. The “App-Related Resources” chapter of the iOS App Programming Guide appears to be the best source of information at the moment. See also “Custom Icon and Image Creation Guidelines” in Apple’s iOS Human Interface Guidelines.
When you submit the app to the App Store, you will be asked to supply a 1024×1024 PNG, JPEG, or TIFF icon to be displayed at the App Store. Have this icon ready before submission. Apple’s guidelines say that it should not merely be a scaled-up version of your app’s icon, but it must not differ perceptibly from your app’s icon, either, or your app will be rejected (I know this from experience).
The App Store icon does not need to be built into your app; indeed, it should not be, as it will merely swell the built app’s size unnecessarily (remember that space is at a premium on a device, and that your app must be downloaded from the App Store, so users appreciate your keeping your app as small as possible). On the other hand, you will probably want to keep it in your project (and in your project folder) so that you can find and maintain it easily. So I recommend that you import it into your project and copy it into your project folder, but do not add it to any target.
If you created a 512×512 icon file for Ad Hoc distribution, you may wish to delete it from the Copy Bundle Resources build phase now so that it doesn’t swell the final app’s size unnecessarily.
There is a delay between the moment when the user taps your app’s icon to launch it and the moment when your app is up and running and displaying its initial window. To cover this delay and give the user the sense that something is happening, you must provide a launch image to be displayed during that interval.
The launch image might be just a blank depiction of the main elements or regions of the app’s interface, so that when the actual window appears, those elements or regions will seem to be filled in. The best way to create such a launch image is to start with a screenshot of your app’s actual initial interface. That way, all you have to do is blank out the details. Typically, I add some temporary code to my app such that it will launch into a blank version of its normal interface; I then take a screenshot of that, and remove the temporary code. Taking screenshots is covered in the next section.
You do not need to blank out the status bar. On an iPhone (or iPad touch), the status bar area of your launch image will be covered by the real status bar. For an iPad, you must trim the status bar area off your launch image entirely. (I use the shareware GraphicConverter, http://www.lemkesoft.com, to do this easily and precisely.)
Starting with the advent of the iPhone 5 (and fifth-generation iPod touch), whose screen has a longer height dimension, the runtime now uses the launch image for a second purpose — namely, to determine whether your app is to run “natively” on these devices. The rule is that if your app contains a launch image specifically targeted to this elongated screen size, your app will occupy the entire screen; if not, it will be displayed letterboxed, at the size of the iPhone 4 screen, with black bars at the top and bottom.
Note
Don’t add an iPhone 5 launch image to your app unless it can run natively on the iPhone 5! Your app must be able to respond to the fact that it might appear in the iPhone 4’s shorter screen dimensions or in the iPhone 5’s longer screen dimensions. This will require adjustment of the interface in real time. The best way to perform such adjustment is through autolayout constraints (Chapter 14), but of course there’s a backwards-compatibility trade-off here, because (as I mentioned earlier in this chapter) you can’t use autolayout constraints in an app running on iOS 5 or earlier.
A launch image must be a PNG file, and must be named Default.png with the addition of appropriate name qualifiers. An iPhone app will typically have a single initial launch orientation, but an iPad app is supposed to launch into either portrait or landscape orientation and thus requires a launch image for each orientation. A minimally full set of launch images must therefore have the following names and sizes:
- Default.png, 320×480 pixels
- Default@2x.png, 640×960 pixels (Retina)
- Default-568h@2x.png, 640×1136 pixels (iPhone 5)
- Default-Portrait~ipad.png, 768×1004 pixels
- Default-Landscape~ipad.png, 1024×748 pixels
- Default-Portrait@2x~ipad.png, 1536×2008 pixels (Retina)
- Default-Landscape@2x~ipad.png, 2048×1496 pixels (Retina)
The current versions of the Xcode app templates include initial all-black versions of the three iPhone launch images. This is a courtesy that permits you to run your app on the iPhone 5, including the Simulator, at native size from the outset. You’ll need to replace these with real launch images before submission to the App Store.
Warning
Annoyingly, initial all-black versions of the four iPad launch images are not included in the app templates — and the consequence is that, for a universal app, the iPhone launch images are wrongly used on the iPad! I have submitted a bug to Apple regarding this, and my impression is that I’m not the only one.
In Xcode 4.5 and later, adding launch images is easy. Delete the existing launch images first. Now edit the target and drag-and-drop each launch image onto the appropriate area of the Summary tab. Xcode will copy and rename the image for you, and include it in your target and the Copy Bundle Resources build phase. For example, if I drop a 320×480 PNG file called myLaunchImage.png onto the first iPhone launch image space for our Empty Window project, it is copied into the project and added to the target, and the copy is renamed Default.png.
In theory, you can use the orientation suffixes in the names of launch images on the iPhone as well. To distinguish between a launch image to be used on the iPhone and a launch image with the same orientation suffix to be used on the iPad, use additional suffixes ~ipad and ~iphone.
Thus you can end up with file names like Default-Portrait@2x~iphone.png. In addition, you can replace Default with some other base name by creating the “Launch image” key in your Info.plist file and setting its value appropriately; but I’ve never done that.
For further details, see the “App-Related Resources” chapter of the iOS App Programming Guide, and “Custom Icon and Image Creation Guidelines” in Apple’s iOS Human Interface Guidelines.
When you submit the app to the App Store, you will be asked for one or more screenshots of your app in action to be displayed at the App Store. You should take these screenshots beforehand and be prepared to provide them during the app submission process.
The required screenshot sizes are listed in Apple’s iTunes Connect Developer Guide, under “Adding New Apps”; look for Table 7-3, “Icon and screenshot field descriptions”. The dimensions of a screenshot depend on its orientation, the screen size, and whether this is a full-screen app — if it isn’t, you must trim the status bar off the screenshot. You must provide at least one screenshot corresponding to the screen size of every device on which your app can run, except that all screenshots must be double-resolution — not because the target device will necessarily be double-resolution, but because there’s a chance that this screenshot will be viewed on a double-resolution device. Typical screenshot dimensions for an app that displays the status bar are thus 640×920 or 960×600 (iPhone), 640×1096 or 1136×600 (iPhone 5), and 1536×2008 or 2048×1496 (iPad).
You can obtain screenshots either from the Simulator or from a device connected to the computer. The Simulator is a particularly good approach when you need a double-resolution launch image and you don’t have a double-resolution device.
If you’re going to use the Simulator, configure it to the correct device with the Hardware → Device menu. Run the app and get it into the desired state. Then:
- Simulator
- In the Simulator application, choose File → Save Screen Shot.
- Device
- In Xcode, in the Organizer window, locate your device under Devices and click Screenshots. Click New Screenshot, at the lower right of the window.
To make screenshots available for upload, select each one in the left side of the Devices tab of the Organizer window and click Export to save it with a nice filename into the Finder. Trim off the status bar if necessary. You may need to rotate a screenshot to get it into the correct orientation.
If a screenshot is listed in the Organizer window, you can turn it directly into a launch image (see the previous section): select it and click Save as Launch Image. A dialog will ask what name to assign to it and what open project to add it to.
A number of settings in Info.plist are crucial to the proper behavior of your app. You should peruse Apple’s Information Property List Key Reference for full information. Most of the required keys are created as part of the template, and are given reasonable default values, but you should check them anyway. The following are particularly worthy of attention:
-
Bundle display name (
CFBundleDisplayName) - The name that appears under your app’s icon on the device screen; this name needs to be short in order to avoid truncation.
-
Status bar style (
UIStatusBarStyle) -
On the iPhone and iPod touch, the look of the status bar. (On the iPad, the status bar is always black opaque.) In Xcode 4.5 and later, you can set this value using the Style pop-up menu in the Summary tab when you edit your target. Your choices are Default (“Gray style”,
UIStatusBarStyleDefault), Black Translucent (“Transparent black style”,UIStatusBarStyleBlackTranslucent), and Black Opaque (“Opaque black style”,UIStatusBarStyleBlackOpaque). This setting will be used in conjunction with your launch image, even before the app is actually running.However, in iOS 6 the old default status bar style (“Gray style”) won’t appear when the app runs. Instead, the default status bar is black opaque, and if your Style choice is Default, the Tinting pop-up menu comes into play. The reason is that, in iOS 6 on an iPhone, whenever there is a navigation bar at the top of the screen (Chapter 25), the status bar is automatically tinted to match it. You cannot prevent this behavior. Therefore, if there is a navigation bar at the top of your app’s initial interface, you might like the status bar that appears during launch to match the running app’s initial status bar. (Otherwise, the status bar will appear to change color during launch — which is no terrible thing, and in my experience Apple won’t reject your app for it.) To arrange that, you must describe your initial navigation bar in your Info.plist:
- If your initial navigation bar has a standard color style (Default, Black Translucent, or Black Opaque), use that style here.
- If your initial navigation bar has a tint color, use Custom Color and set the tint color in the color well.
- If your initial navigation bar has a custom background image, use Custom Image and choose that image. (If your app draws a custom image from scratch at runtime, run in the Simulator to show the interface, use Custom Color, show the color picker, click the magnifying glass icon, and sample the color of a pixel near the bottom of your running app’s navigation bar.)
- If there is no initial navigation bar, use Disabled; the status bar will be black opaque during launch.
If your Tinting choice is not Disabled, the “Status bar tinting parameters” key (
UIStatusBarTintParameters) is set to a “Navigation bar” dictionary describing the navigation bar.If the status bar is to be hidden initially, set “Status bar is initially hidden” (
UIStatusBarHidden) instead. -
Supported interface orientations (
UISupportedInterfaceOrientations) - In iOS 6, this key designates the totality of orientations in which the app is ever permitted to appear (Chapter 19). This is a major change from iOS 5 and before. You can perform this setting graphically in the Summary tab when editing your target. But you may also need to edit the Info.plist manually to rearrange the order of possible orientations, because on an iPhone the first orientation listed is the one into which the app will actually launch.
-
Required device capabilities (
UIRequiredDeviceCapabilities) -
You should set this key if the app requires capabilities that are not present on all devices. Be sure to look over the list of possible values. Don’t use this key unless it makes no sense for your app to run at all on a device lacking the specified capabilities.
(The current project templates include
armv7in the list of required device capabilities. This may prove troublesome for backwards compatibility.)
Property list settings can adopt different values depending on what device type you’re running on. To specify that a property list setting applies only on a particular type of device, you add to its key the suffix ~iphone,
~ipod,
or ~ipad. This feature is typically useful in a universal app, as I described earlier in this chapter.
Your app also needs a version number. Edit the Target and click Summary at the top of the page; enter a version string in the Version text field. Things are a little confusing here because there is both a Version field and a Bundle field; the former corresponds to “Bundle versions string, short” (CFBundleShortVersionString), while the latter corresponds to “Bundle version” (CFBundleVersion). As far as I can determine, Apple will pay attention to the former if it is set, and otherwise will fall back on the latter. In general I play it safe and set both to the same value when submitting to the App Store. The value needs to be a version string, such as “1.0”. This version number will appear at the App Store. Failure to increment the version string when submitting an update will cause the update to be rejected.
Before submitting your app to the App Store, build it (Product → Archive) and test it as an Ad Hoc build. The archived build that appears in the Organizer window can be used to generate either an Ad Hoc build or an App Store build. You can’t test an App Store build, so you use this archived build to generate an Ad Hoc build and test with that. When you generate the App Store build, you use this same archived build; it is the exact same binary, so you are guaranteed that its behavior will be exactly the same as the build you tested. (That is one of the purposes of archiving.)
When you’re satisfied that your app works well, and you’ve installed or collected all the necessary resources, you’re ready to submit your app to the App Store for distribution. To do so, you’ll need to make preparations at the iTunes Connect website. You can find a link to it on the iOS developer pages when you’ve logged in at Apple’s site. You can go directly to http://itunesconnect.apple.com, but you’ll still need to log in with your iOS Developer username and password.
Note
The first time you visit iTunes Connect, you should go to the Contracts section and complete submission of your contract. You can’t offer any apps for sale until you do, and even free apps require completion of a contractual form.
I’m not going to recite all the steps you have to go through to tell iTunes Connect about your app, as these are described thoroughly in Apple’s iTunes Connect Developer Guide, which is the final word on such matters. But I’ll just mention the main pieces of information you will have to supply:
- Your app’s name
- This is the name that will appear at the App Store; it need not be identical to the short name that will appear under the app’s icon on the device, dictated by the Bundle Display Name setting in your Info.plist file. This name can be up to 255 characters long, though Apple recommends that you limit it to fewer than 70 and ideally to fewer than 35 characters. You can get a rude shock when you submit your app’s information to iTunes Connect and discover that the name you wanted is already taken. There is no reliable way to learn this in advance, and such a discovery can require a certain amount of scrambling on your part: you might have to Build and Archive your app yet again with a new name and possibly other last-minute changes.
- Description
- You must supply a description of fewer than 4,000 characters; Apple recommends fewer than 580 characters, and the first paragraph is the most important, because this may be all that users see at first when they visit the App Store. It must be pure text, without HTML and without character styling.
- Keywords
- This is a comma-separated list shorter than 100 characters. These keywords will be used, in addition to your app’s name, to help users discover your app through the Search feature of the App Store.
- Support
- This the URL of a website where users can find more information about your app; it’s good to have the site ready in advance.
- Copyright
- Do not include a copyright symbol in this string; it will be added for you at the App Store.
- SKU number
- This is unimportant, so don’t get nervous about it. It’s just a unique identifier, unique within the world of your own apps. It’s convenient if it has something to do with your app’s name. It needn’t be a number; it can actually be any string.
- Price
- You don’t get to make up a price. You have to choose from a list of pricing “tiers.”
- Availability Date
- There’s an option to make the app available as soon as it is approved, and this will typically be your choice. Alternatively, Apple will send you an email when the app is approved, and you can then return to iTunes Connect and make the app available manually.
When you’ve submitted the information for your app, you can do a final validation check: return to the Organizer window, select the archived build, and click Validate. (This feature has not worked well for me in the past, however.)
Finally, when you’re ready to upload the app for which you’ve already submitted the information at iTunes Connect, and when the iTunes Connect status for your app is “Waiting for Upload,” you can perform the upload using Xcode. Select the archived build in the Organizer and click Distribute. In the dialog, choose “Submit to the iOS App Store.” You’ll be asked to provide your developer username and password, so that Xcode can make sure that this app really is waiting for upload at iTunes Connect. You’ll then specify your identity as contained in the App Store distribution profile, and Xcode will proceed to upload the app. Some validation will then be performed at the far end.
Alternatively, you can use Application Loader. Export the archive as an .ipa file, as for an Ad Hoc distribution, but use the App Store distribution profile. Launch Application Loader by choosing Xcode → Open Developer Tool → Application Loader, and hand it the .ipa file.
You will subsequently receive emails from Apple informing you of your app’s status as it passes through various stages: “Waiting For Review,” “In Review,” and finally, if all has gone well, “Ready For Sale” (even if it’s a free app). Your app will then appear at the App Store.